
Video Data Stories:
UX Co-Innovation Design integrated Generative AI in SAP Analytics Cloud
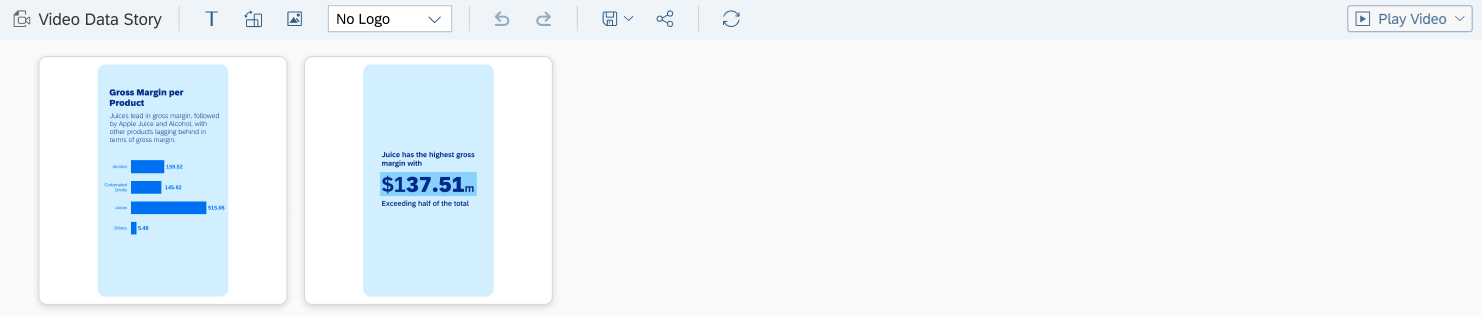
Video Data Stories are bringing short-form video to the enterprise. With personalized content automatically generated for you, concise stories keep you up to date and deliver key insights about your business in a snappy, animated, and convenient format.
Background
When it comes to offering audiences engaging and easy-to-consume content, platforms like Instagram and TikTok lead the way. In the world of business, too, storytelling-on-the-go has huge potential.
We want to enable companies to share business insights fast and in a fresh and immediate way, on the rationale behind the data storytelling solution our team was working on.
The purpose is to provide business users with short, animated “video data stories” about the key activities relevant to their individual roles.
My Role
Scoping, Prototyping, Product design, Interaction design
Team
One Product Manager, One Product Owner, Two Architects, Seven Developers (including SDK devs), Two Designers (for SAC integration and Video Animation)
Duration
May 2024-Nov 2024
OVERVIEW
Goal & Vision
Eye-catching videos that are 10 to 15 seconds long will mean that users won’t have to refer to dashboards or wade through reports as they do today. Built-in templates for the most common business processes will enable anyone to create their own video data story and link it to their data sources. No design or programming experience is required.
A Unified Solution and Traceable Data
The solution’s video data stories apply the same user experience principles as other content-sharing platforms. New videos are displayed in chronological order, and viewers can navigate easily through the different parts of a story or skip entire stories that are not relevant to them.
By incorporating animated visualizations, users can show changes in data over a specific time period dynamically. If more details are needed, they can point the audience to the right people and include links to the data sources and applications.
Sample Business Use Cases and Typical Scenarios
One potential use case is Sales Reporting. The solution has a predefined template that can be used to generate a personalized story for each sales accountant, showing how sales figures have changed over a defined period and including highlights and historical comparisons. Other information, such as headcount growth, quarterly earnings, and fact sheets for communications and sales, can also be shared through video storytelling in a far more compelling way than in PDF files or PowerPoint
As a Sales Account Manager, the user wants to receive weekly video data stories with the most important facts and figures about his team KPIs and latest competitor insights relevant to his accounts.
As a Financial Controller, the user wants to share a video data story with a group of managers to summarize quarterly expenses of the past quarter and to highlight key findings relevant to their organization.
FUNCTIONAL DESIGN
NEW Video Data Story ARTIFACT
A new artifact type "Video Data Story(hereinafter to be referred as VDS)" will be added in SAP Analytics Cloud.
Create a VDS file
The VDS file can be created in story view mode when VDS configuration completes.
Open a VDS file
Open an existing VDS file in:
EDIT MODE
Technically make use of the related story view mode to edit VDS.
VIEW MODE
Render the video (in HTML format) by VDS web player in SAC
Save a VDS file
Save or save as a VDS file without data (save the definition only)
Manage a VDS file
Be able to share a VDS file to others without custom link support.
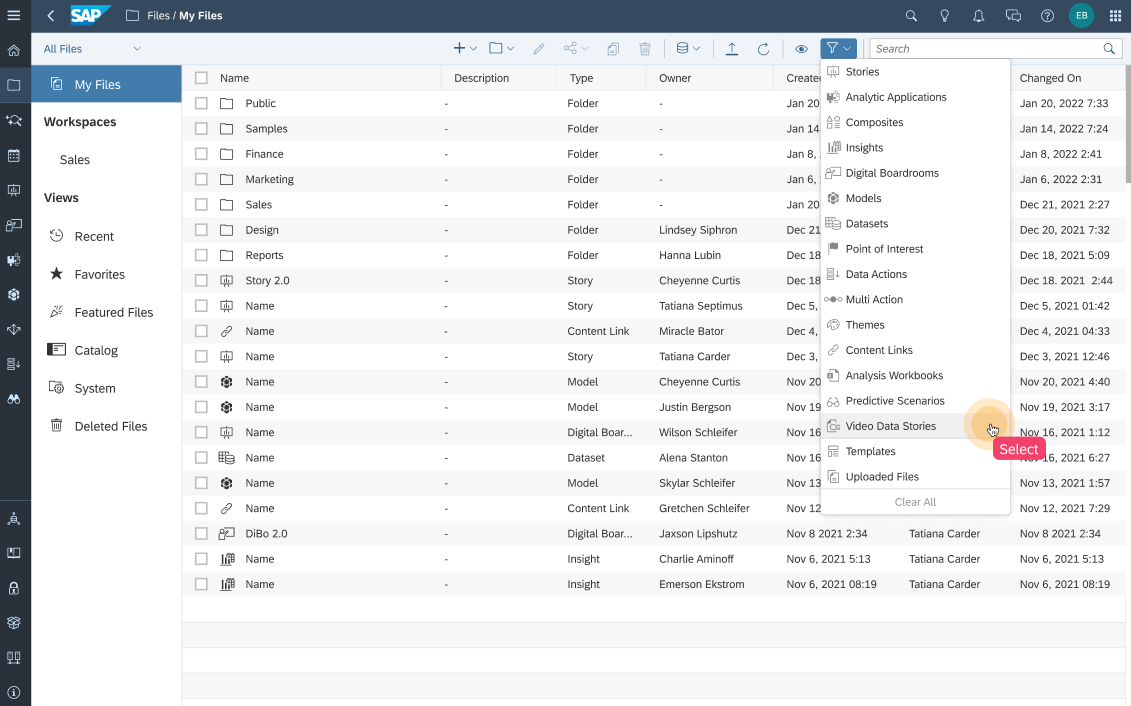
Users are able to manipulate the document in:
File repo with a new type of entry to open/edit/share/delete/copy. The filter quick action should work for VDS file as well.
The "Edit Details" dialog is a simple version which includes Name and Description only.
"Publish to Catalog" & "Schedule Publication" in "Share" should be disabled.
Recent Files in SAC home page to open
New VDS privilege will be added. Permission check when create/save/open/share the VDS file.
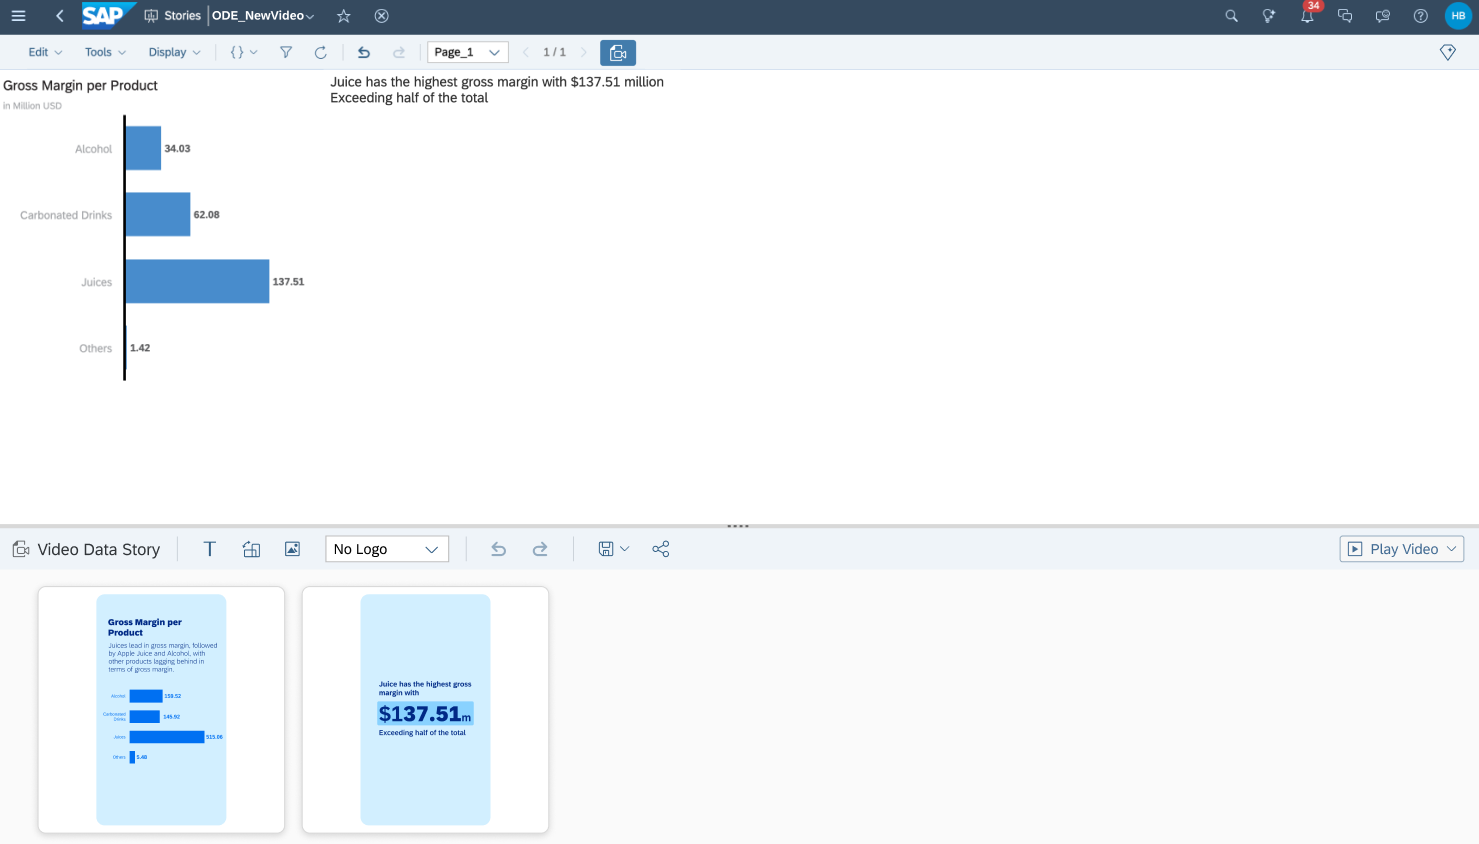
DESIGN A Video Data Story
There are 2 entries to start to design a VDS file:
Start from a story view mode (for VDS file creation)
Story toolbar behavior:
Entry in story toolbar to open/close VDS design panel
Story toolbar items work for story element only (e.g. copy/paste, undo/redo)
If Save As is selected, hide VDS panel and prompt for users to save VDS file if it's dirty.
If Reset/Refresh/Bookmarks is selected, keep VDS design panel.
If switch to present mode and try to open VDS design panel via widget context menu, inform users to return to view mode for further VDS configuration.
Open an existing VDS file in its edit/design mode
Always enable the VDS menu entry in toolbar even the VDS feature is off in the related story. Respect the toolbar settings in story for other menu entries.
The enablement of VDS in context menu per chart/text widget will be respected
If Reset/Refresh is selected, keep VDS design panel.
Remove some menu entries in story toolbar
File (i.e. save, export, share, publish)
Edit: Copy, Paste, Paste overall values only
Tools: Bookmarks
Switch to present mode
Switch edit/view
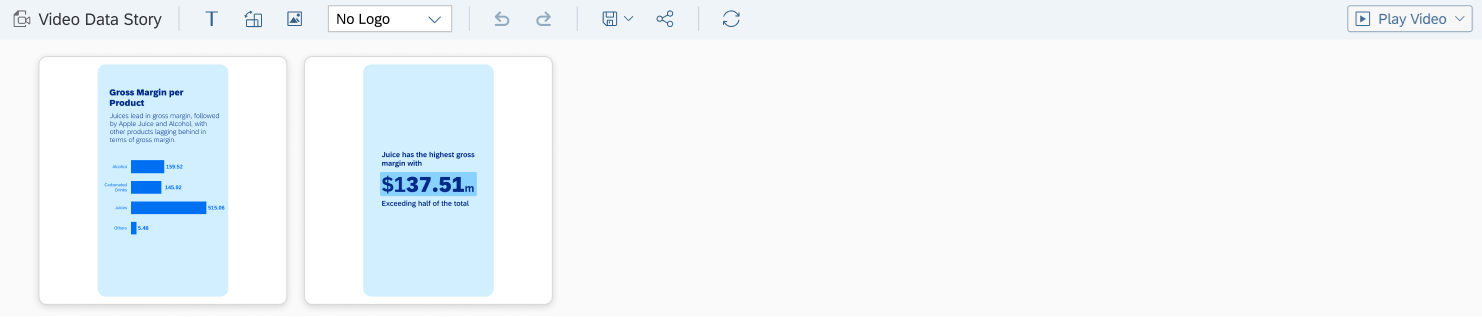
The VDS design panel contains basic UI entries to:
Undo/Redo, Save/Save as, Share, Preview, switch to view mode
These actions are separate from story's.Allow users to update the data to latest version
The data to update includes: story filter value, model variable value, dynamic text.
The UI entry will be marked as "dirty" if change happens when:
"Filter Panel", "Edit Prompts" in story toolbar changes
Dynamic text changes
Scroll left/right if VDS design panel can't show all sections.
Be able to adjust the design panel within min/max height.
Configure a Chart Section
Add or delete a chart of Bar / Column, Pie, Line, and Numeric from story as one section in VDS:
Add the chart directly
Add the chart after interacting via filter, drill, sorting, ranking
Convert story filter/variable to local with the state when adding it to VDS
Instead of showing a tick in the front of "Add to VDS" context menu, the related sections in VDS design panel will be highlighted when chart selection.
The chart section is rendered as it is in final video, including:
Layout & styling (ignore story-related settings, incl. theme).
Section size (i.e. landscape or portrait)
The ratio is respected when resizing the design panel.
Options in chart section to customize:
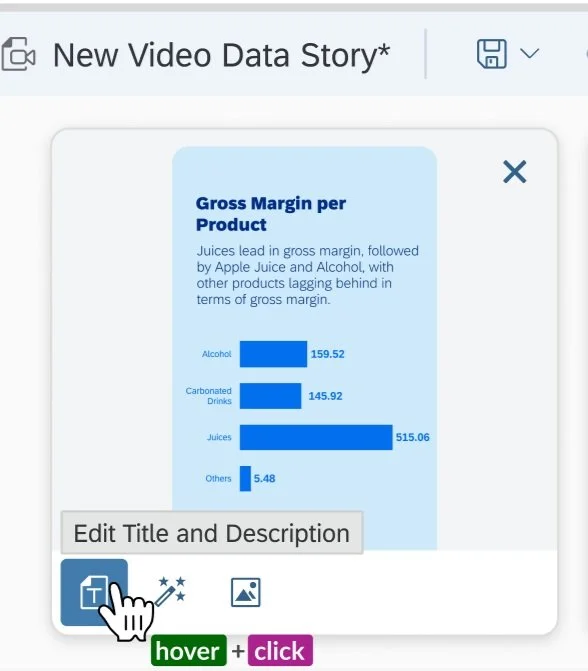
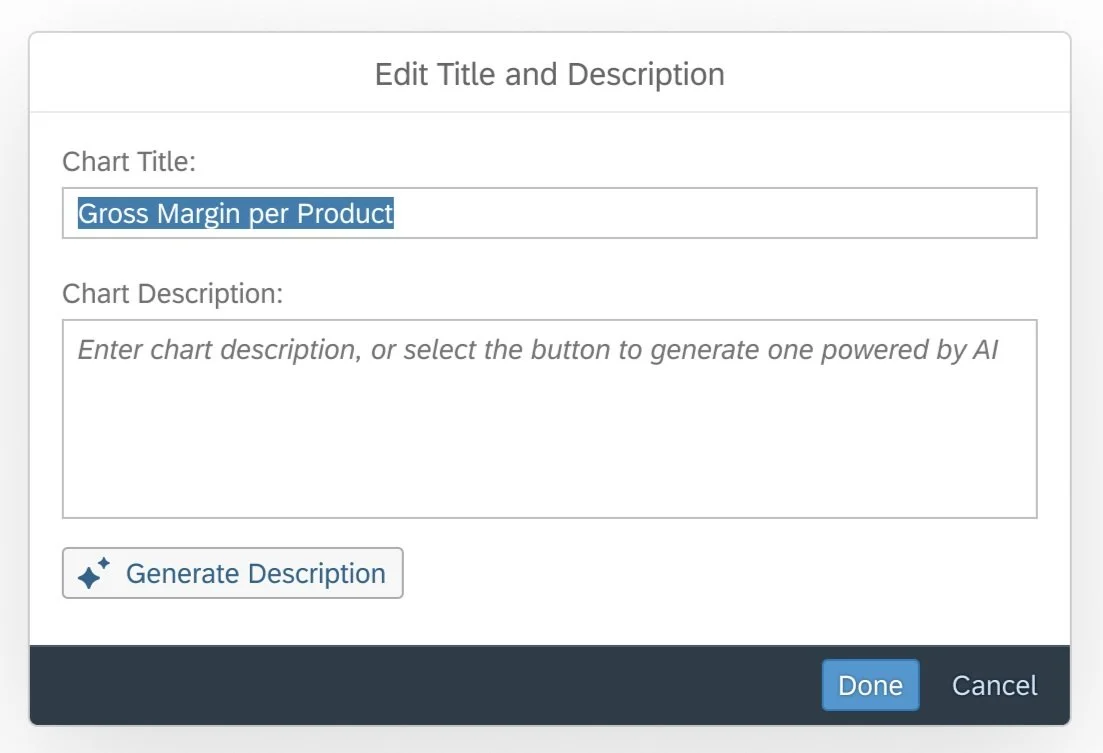
Title
The default title is derived from the chart title of the story.Description
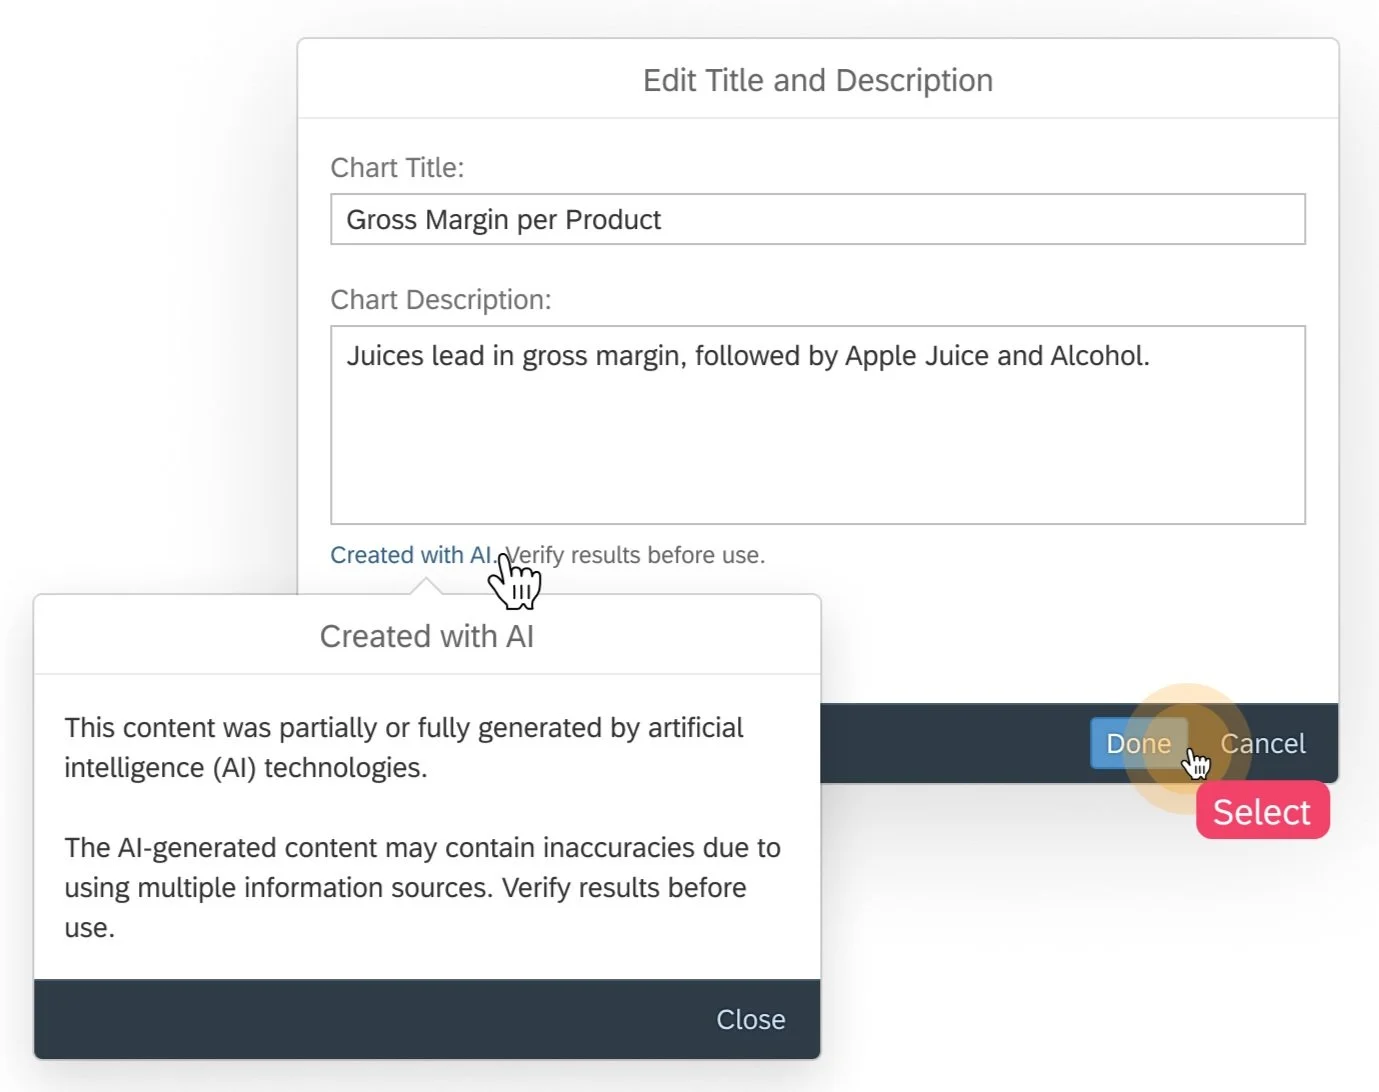
Be able to generate the description of the corresponding section using AI Capability as well.
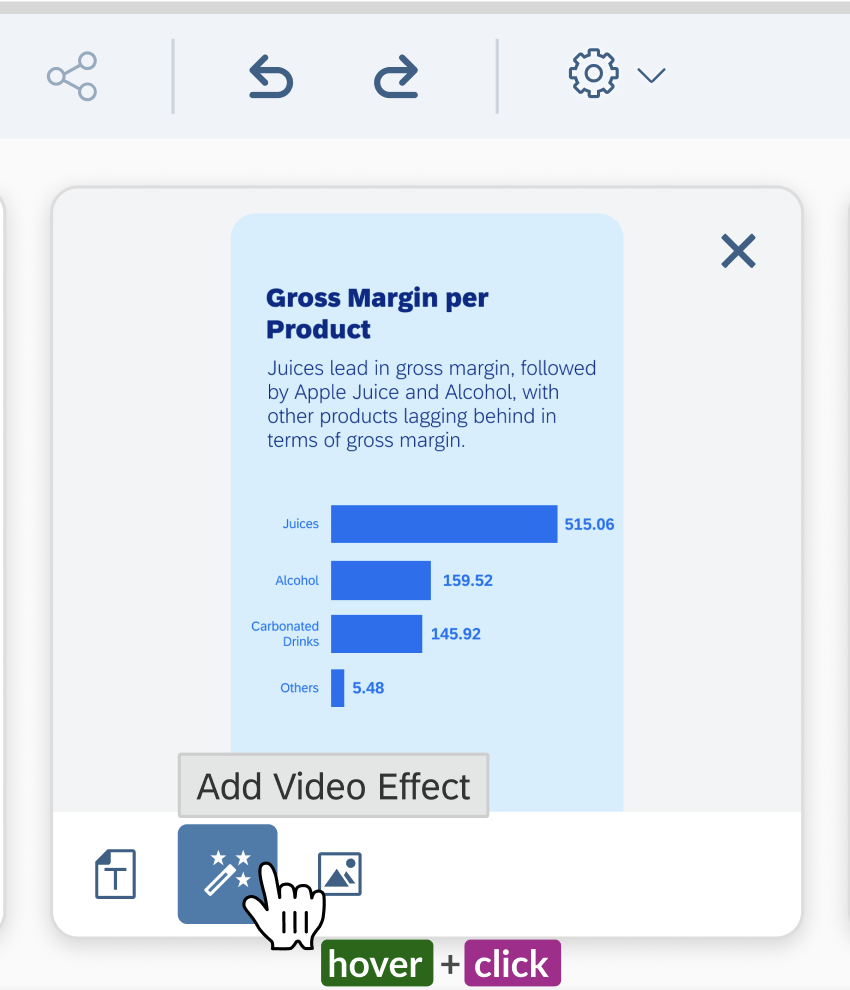
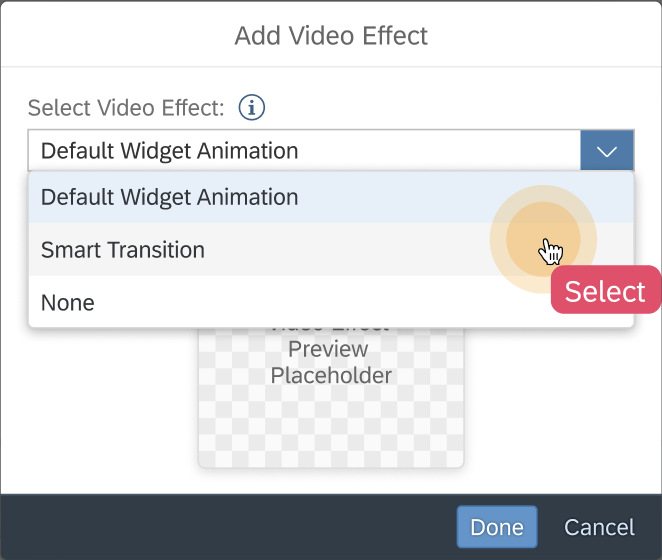
Video Effect (Animation template)
Have an option to select among pre-delivered animation template list, which may be various per chart and can preview in gif. And users can choose "None" to disable the animation.
For Bar / Line with big number of data points (i.e. >8 or 10), have an additional option to enable scrolling effect.
The default animation may also control the following behaviors:
Orientation of bar
Paging effect with multiple dimensions or measures (one page for one dimension members)
Configure Sections
Options between sections to customize:
Section sequence adjusted by drag & drop in VDS design panel
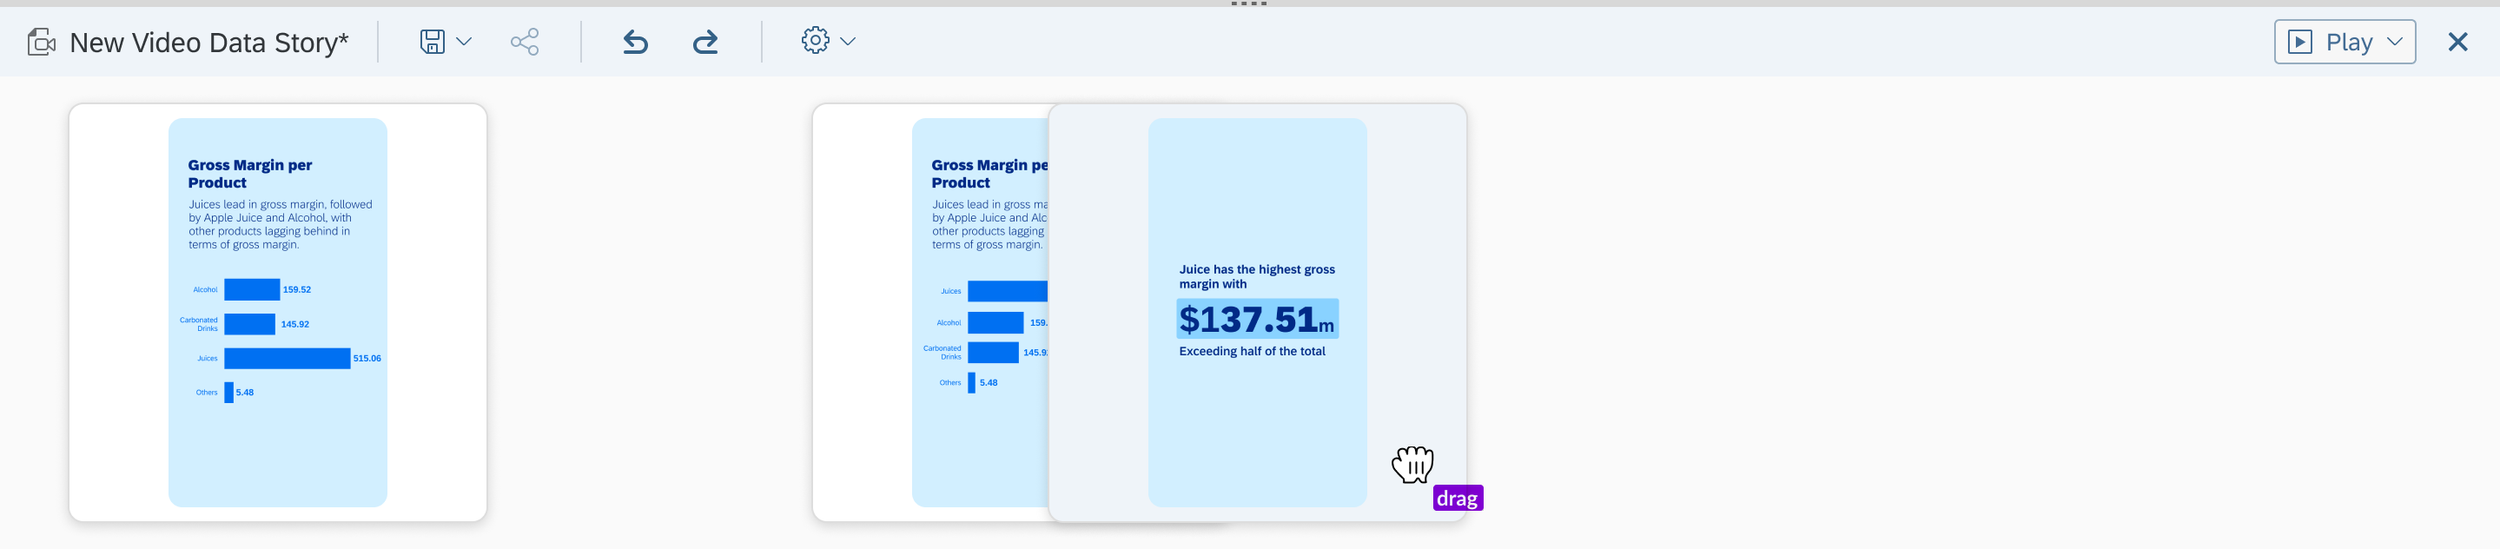
Section transition effect
AI auto-identifies the relationship between adjacent chart sections and provides a recommendation. (Should consider the reverse order, e.g. remove filter, drill up)
Filter (among Bar (Column), Line, Pie)
Same data binding and filter on the in-use dimension
Different data binding and filter on the in-use dimension of the first section
Linked Analysis case
Drill
Same data binding among Bar (Column), Line, PieSorting
Same data binding among Bar (Column), Line, PieRanking
Same data binding among Bar (Column), Line, Pie
When a recommended transition effect is applicable, be able to enable this effect between adjacent chart sections. And remove or re-generate it later.
There are two entries to enable the AI-recommended transition effect:
The 2 entries status is synced with each other, and only available when the AI-recommended transition effect is applicable.Via the action between chart sections
Select the transition effect in the animation template list of the later chart section
Need to re-identify the relationship between adjacent chart sections if section sequence changes.
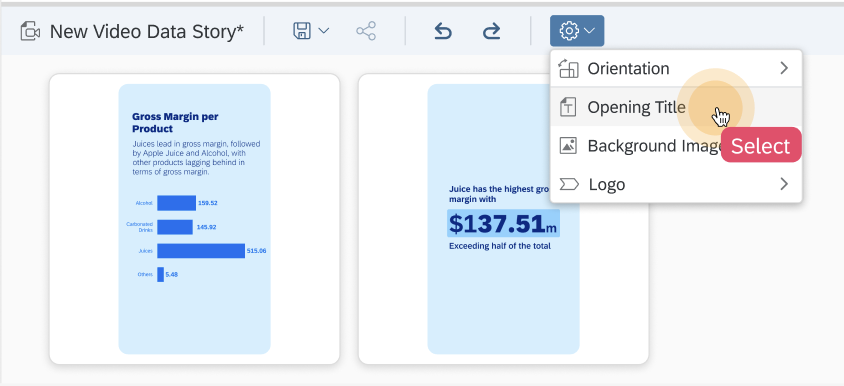
Configure Video
Options of the whole video to customize:
Orientation
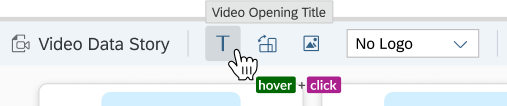
Video opening title
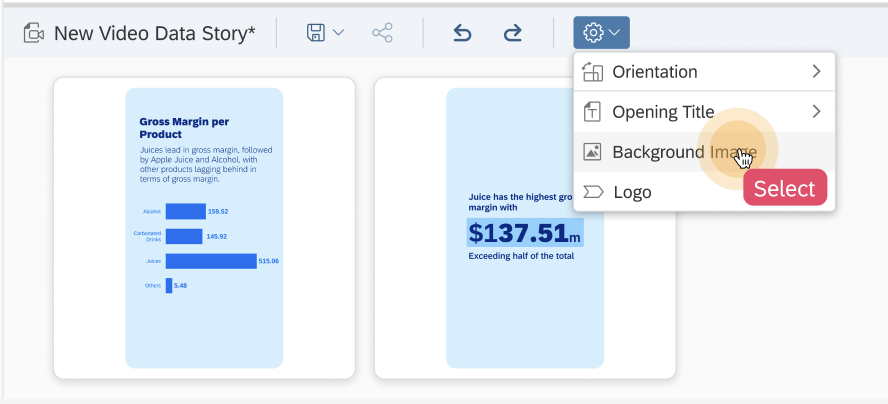
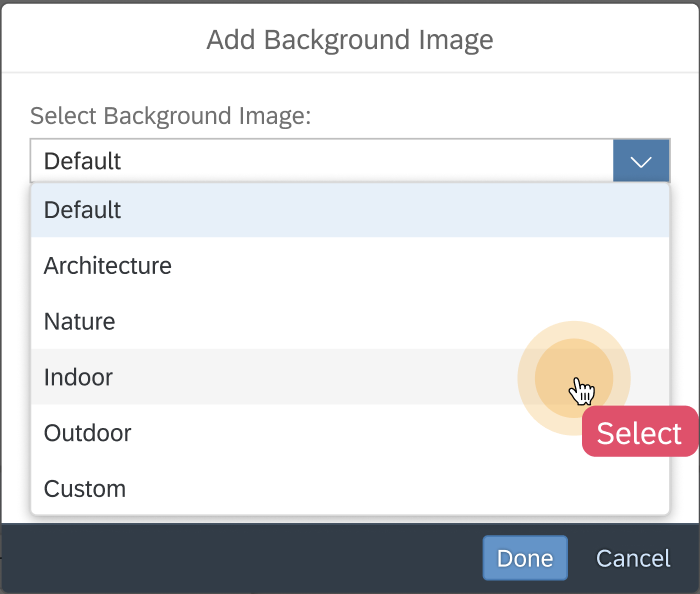
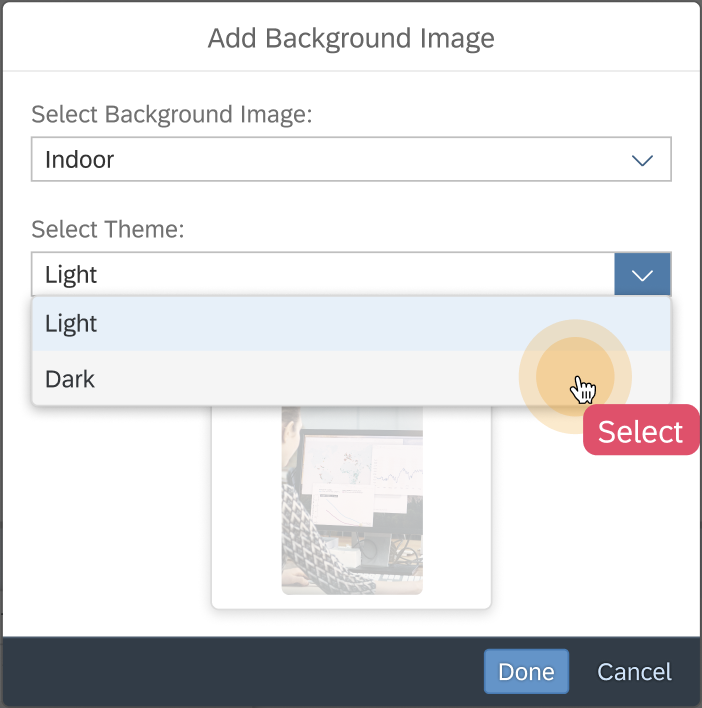
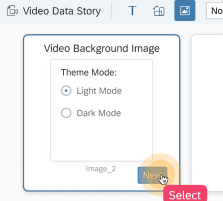
Background image
Select a picture as the background from a pre-delivered list, and be able to choose between dark and light mode.
And be able to upload a picture as the background of the video. (Nice to Have)Customer logo
Be able to decide if a customer logo is needed in the video. The logo comes from the existing SAC system setting.
Show the customer logo on each section corner.
The video will be rendered using default template.
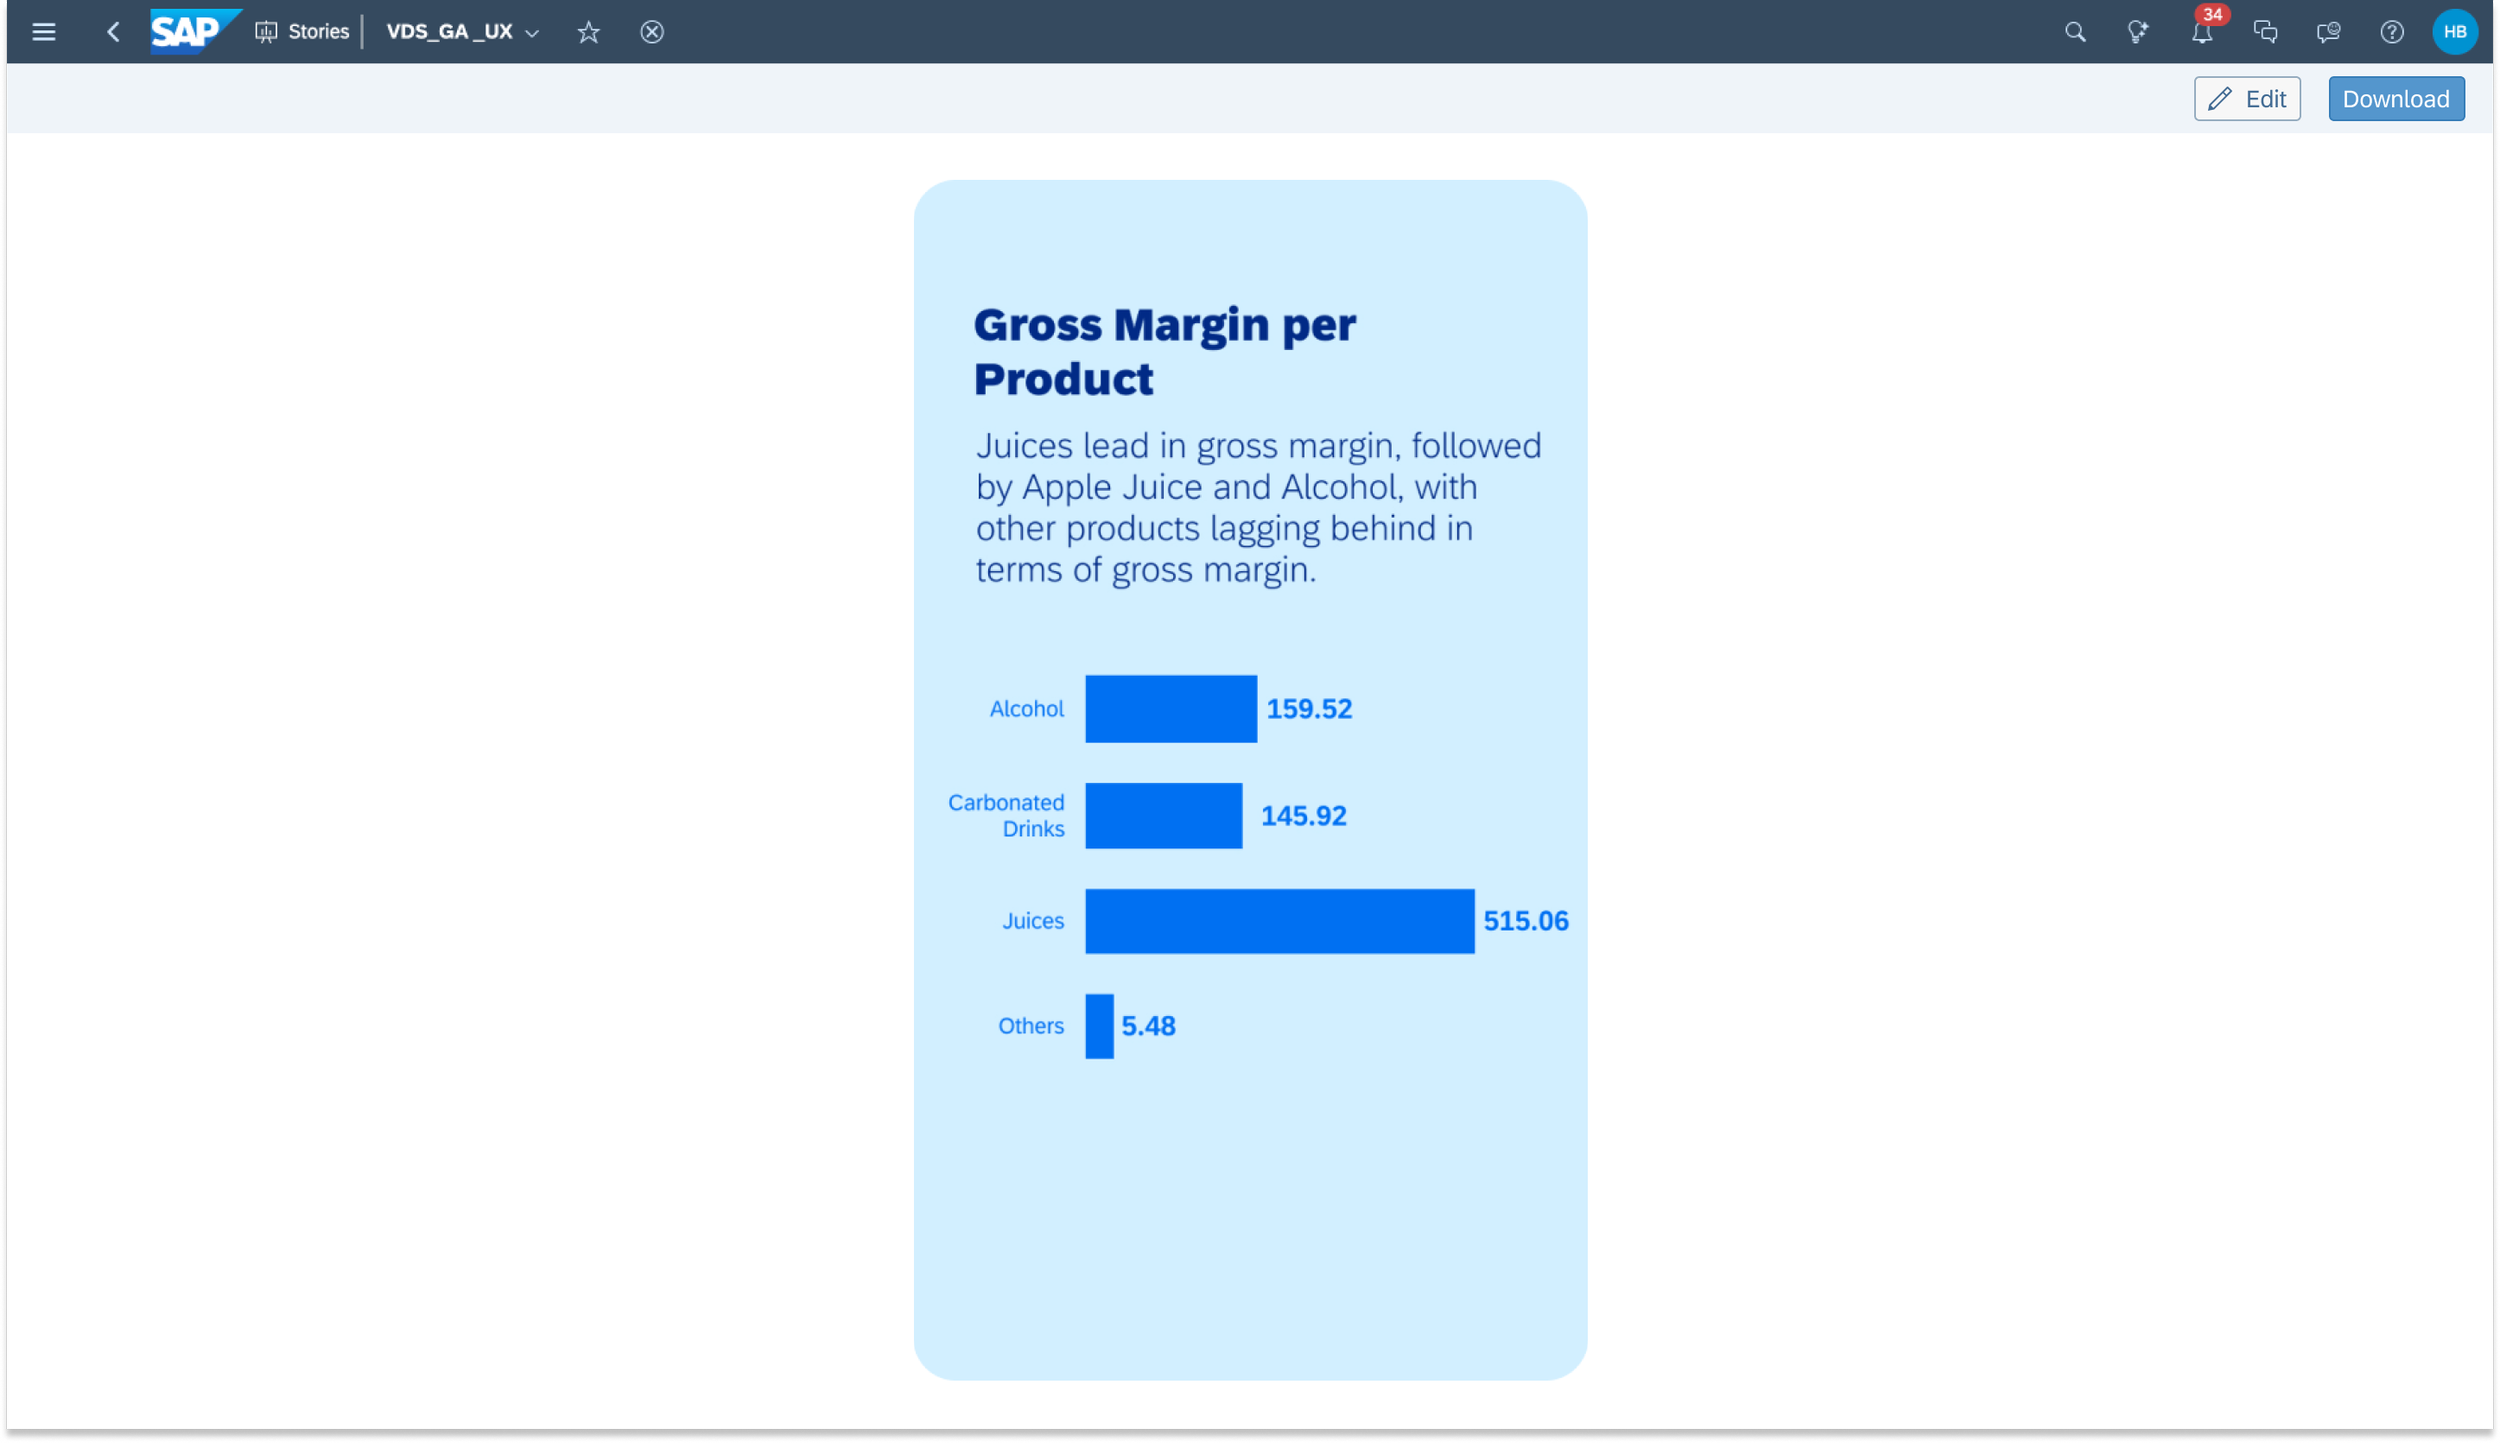
VIEW and GENERATION
Preview video when design a VDS:
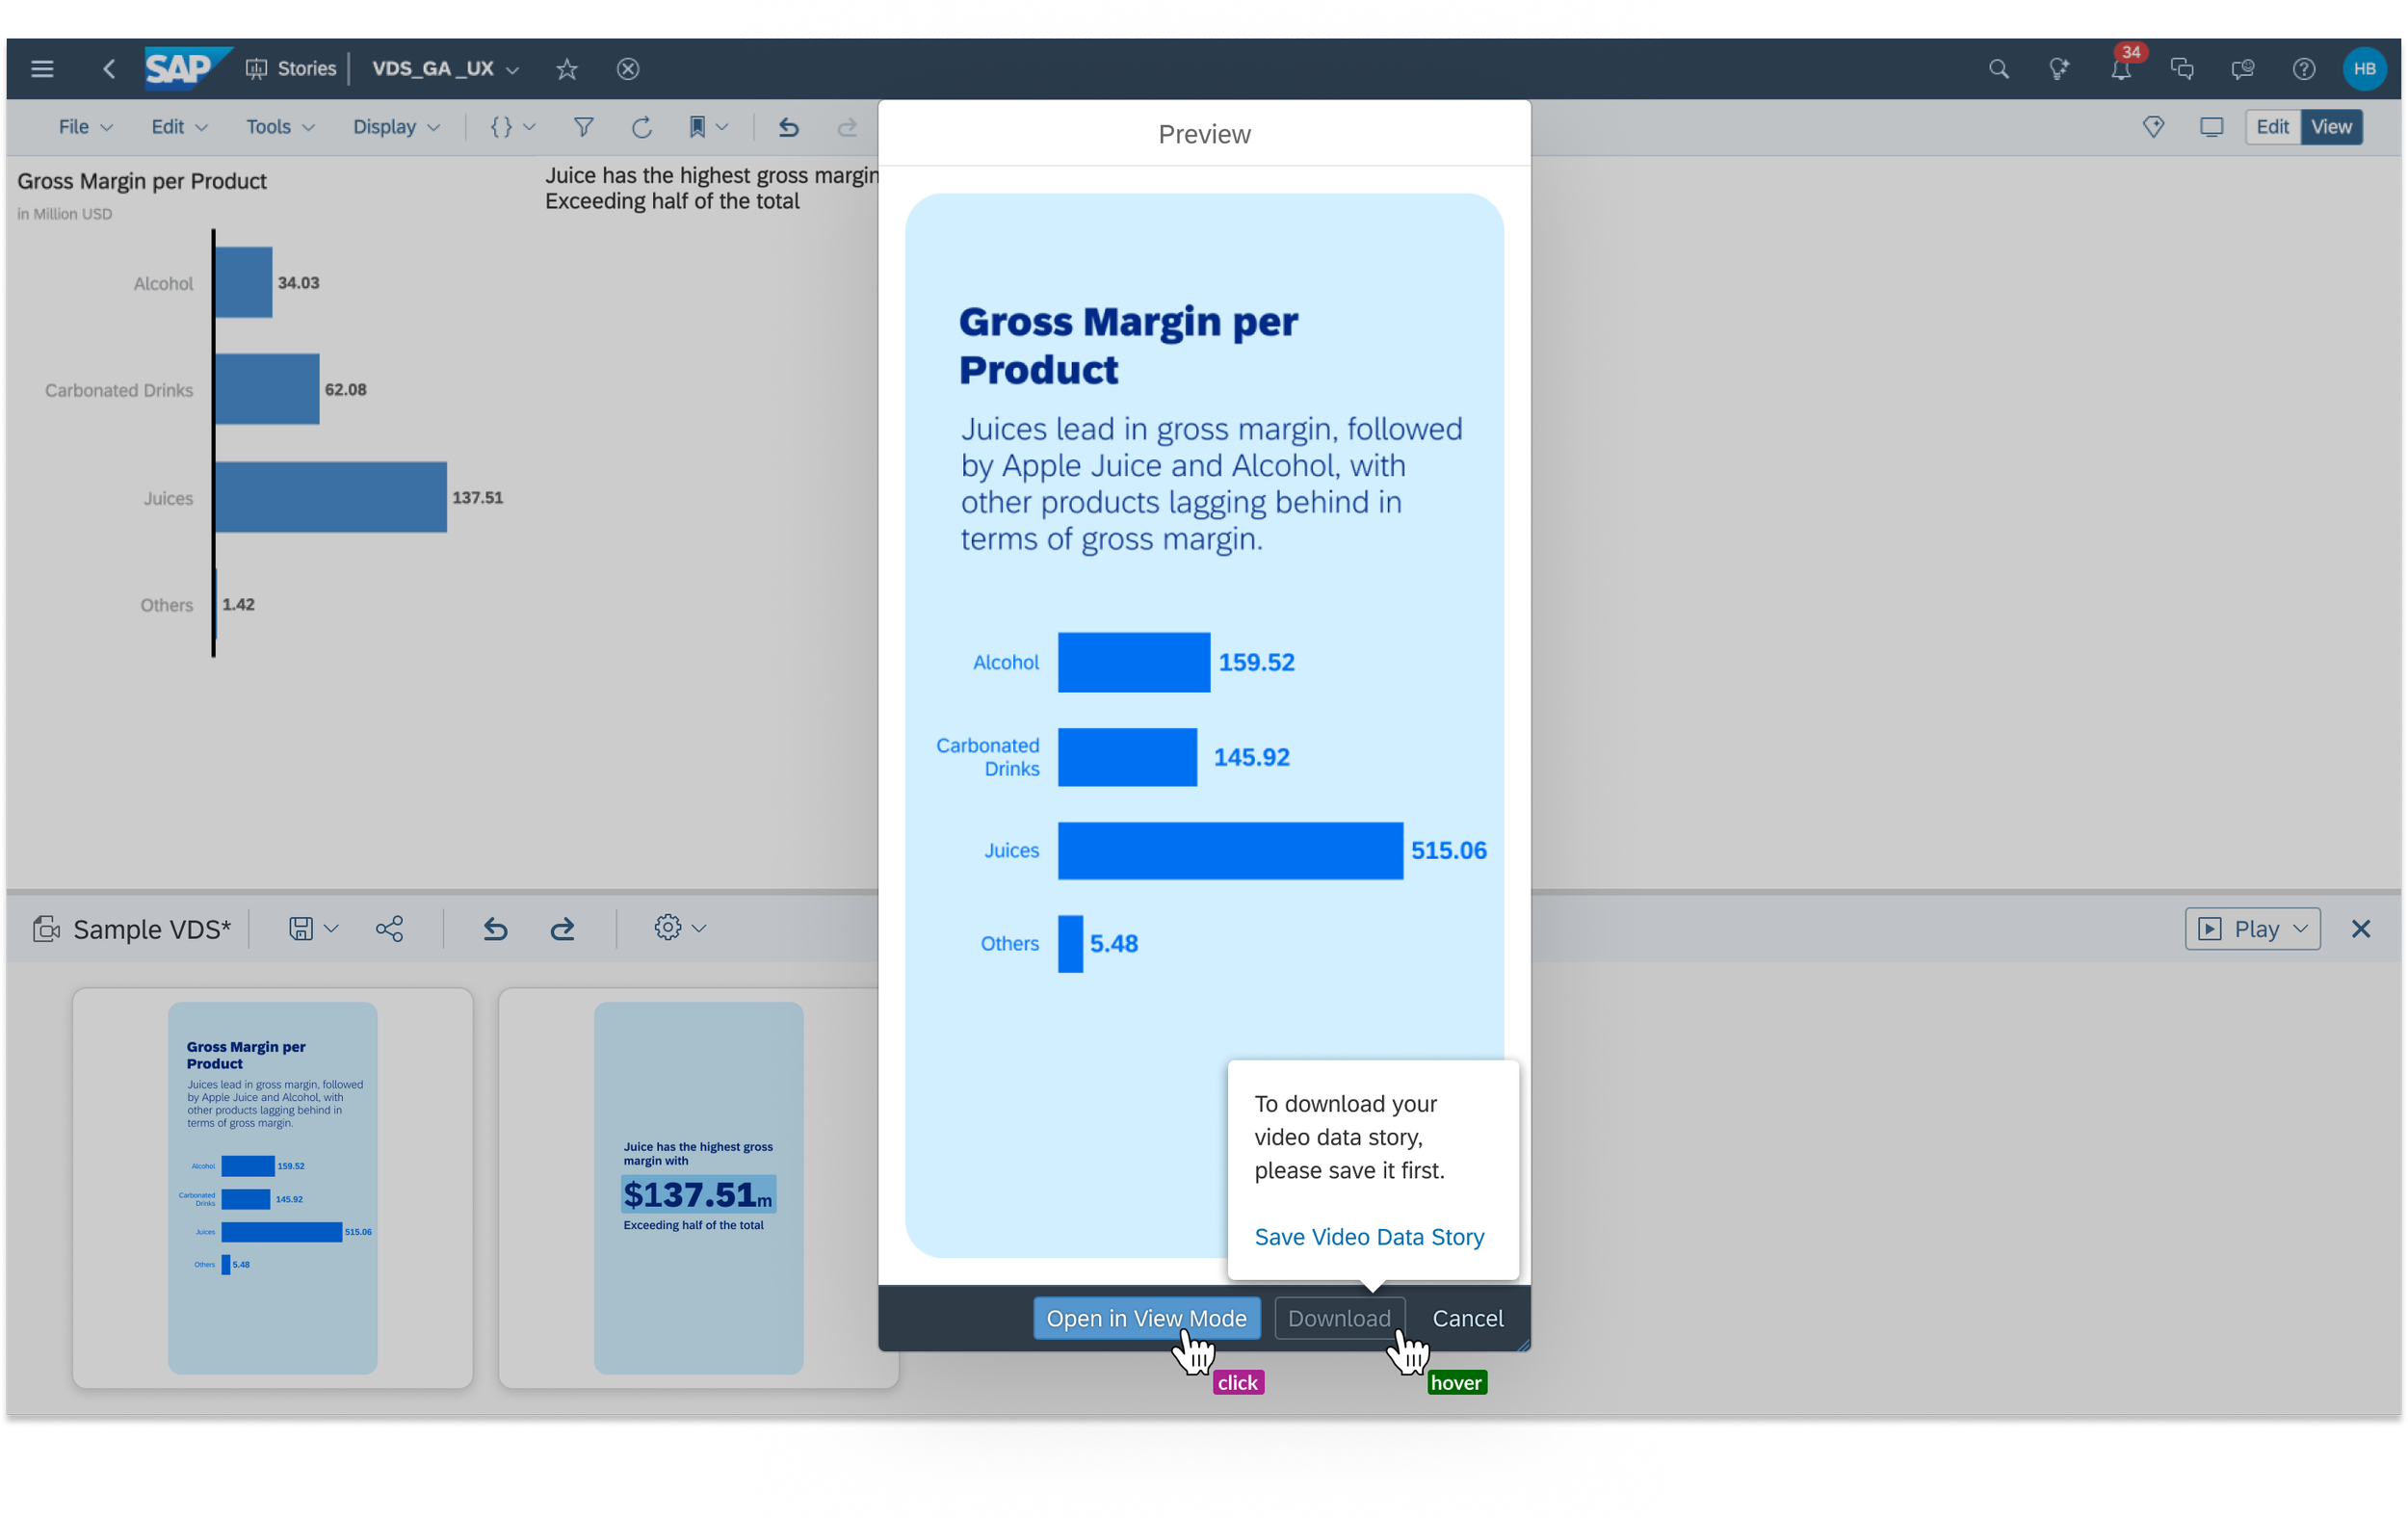
The preview will include the configurations set for sections and video.
The preview should be a playable HTML format which can be embedded in the SAC UI.
Users can switch to VDS view mode.
Be able to generate and download the video in WebM format from both VDS view mode and edit mode.
ITERATIONS DESIGN
Considering the feedback from stakeholder design review sessions, we iterated for focused improvement areas:
Design Panel Toolbar
Video Background Image
Chart Video Effect
Video Data Story Design Panel Toolbar - Integrate all video-related customization configurations into the setting menu to harmonize user experience and enhance readability.
Setting action harmonization
The sequence alignment with Story toolbar (sorting as save, share, undo/redo, settings)
Old Design

New Design (Setting Menu)
Old Design (Full Toolbar)
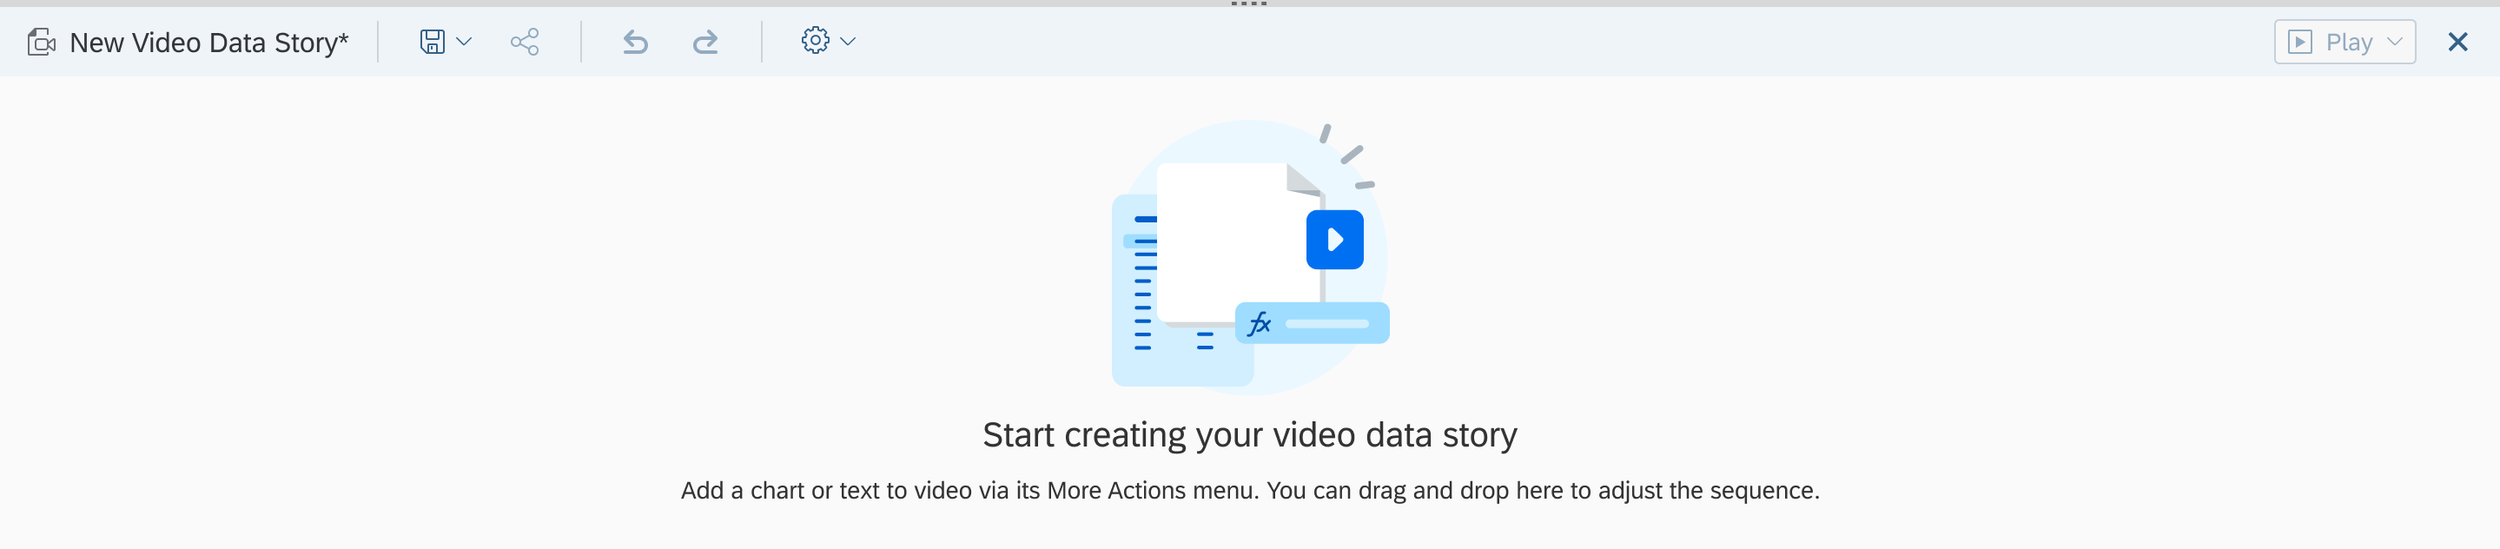
New Design (Full Toolbar in Empty State)
Video Data Story - Video Background Image -
Enhance the readability of the previewed background images - a dedicated preview thumbnail in the dialog
Enable upload of custom images to improve customer personalization needs
Configure light and dark modes to avoid the unreadability of chart/diagrams and text, as well as preview the integrated background
Old Design_1
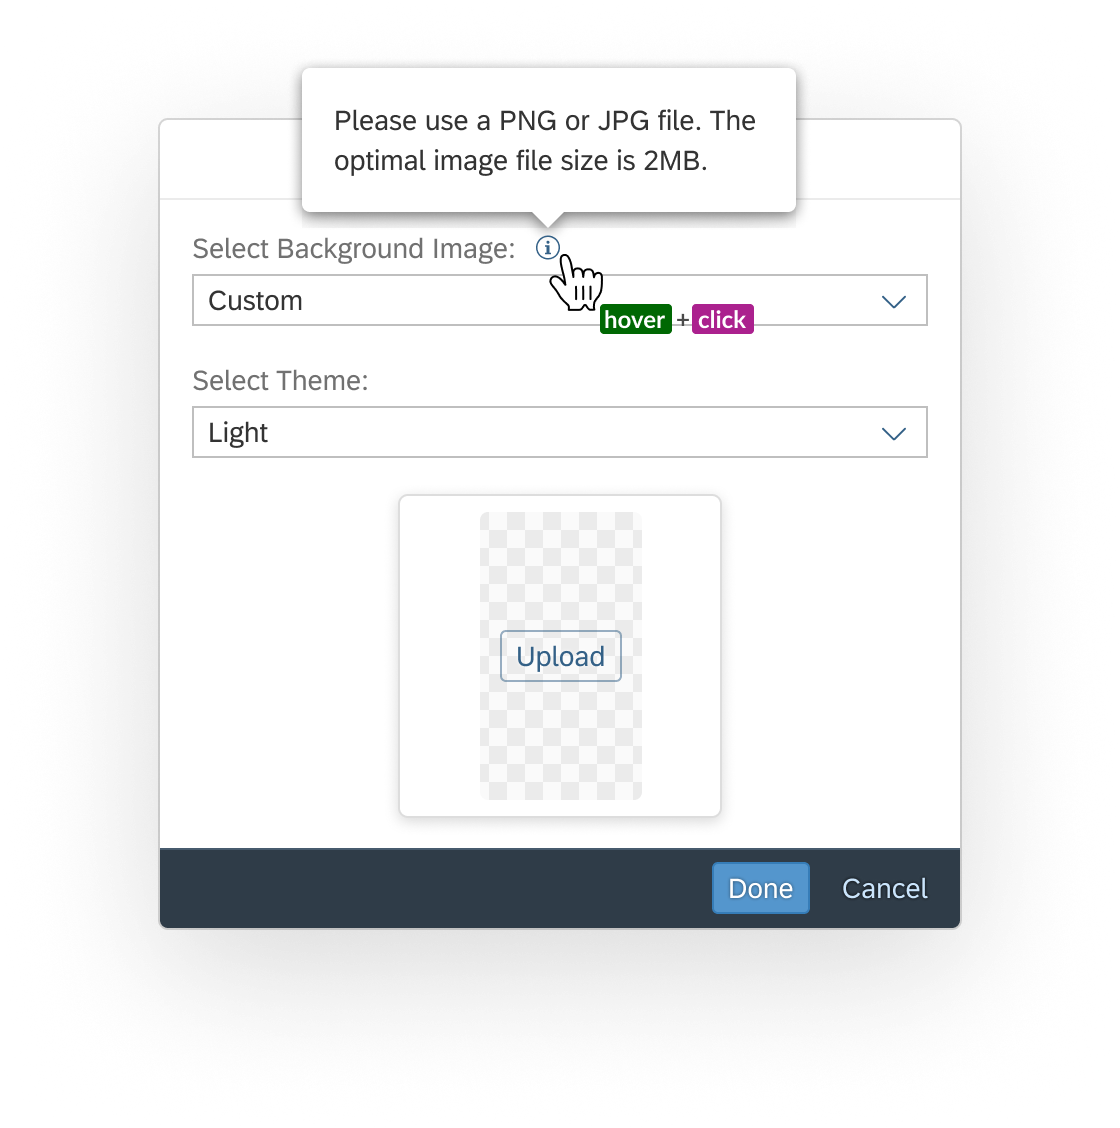
New Design_1
Old Design_2
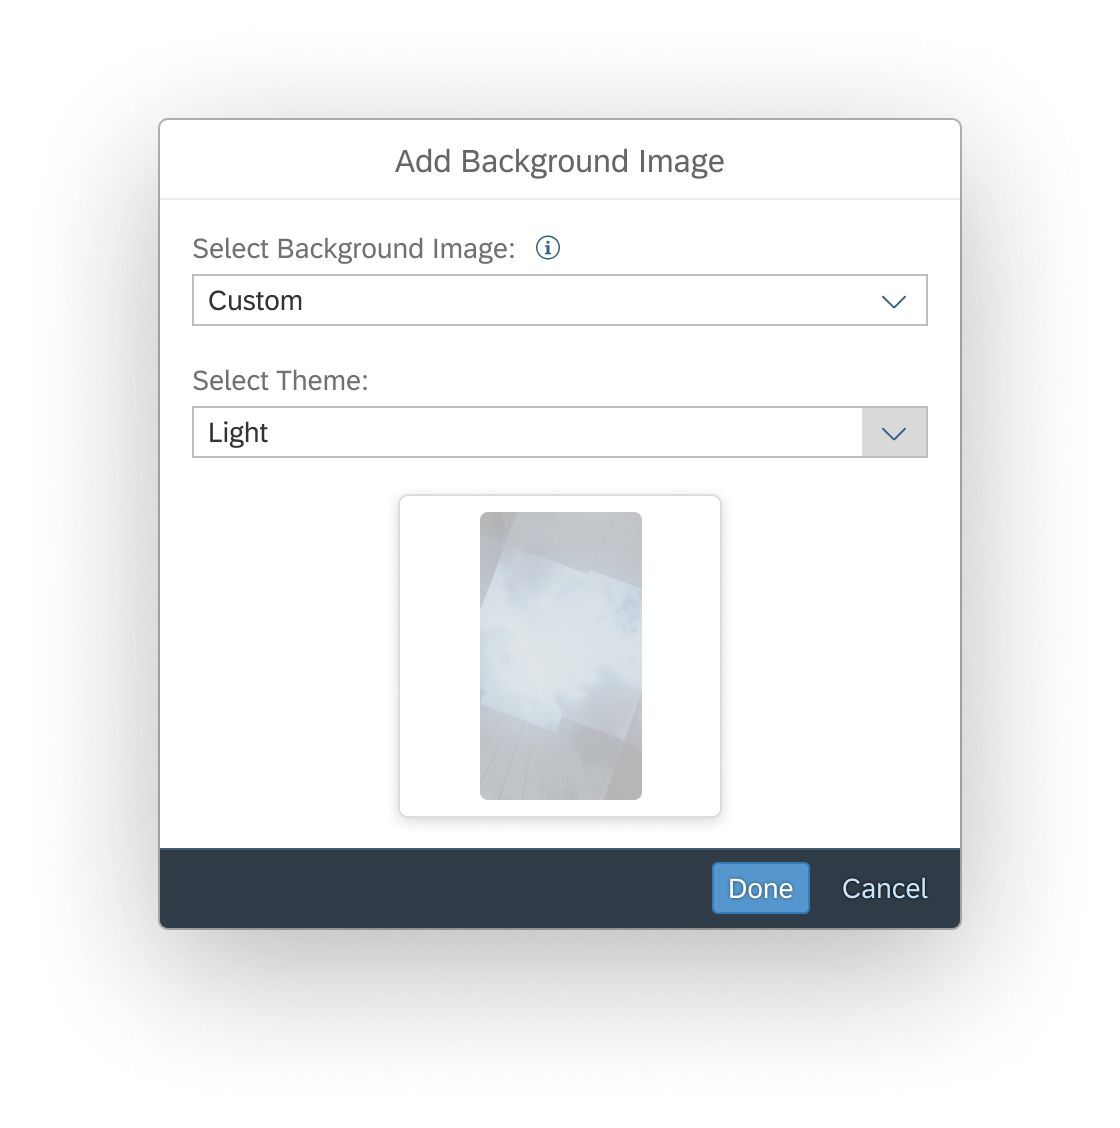
New Design_2
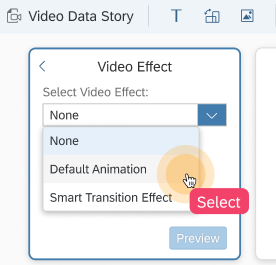
Video Data Story - Chart Video Effect -
Rename old menu strings to Default Widget Animation and Smart Transition to make them understandable and offer info tooltip to
Enhance the readability and usability of the previewed video effect - a dedicated video(gif) thumbnail in the dialog
Old Design

New Design
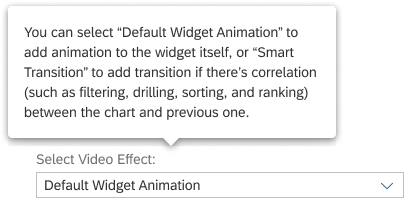
New Design_Info Tooltip
New Design_Preview Video Effect
VISION & LOOK AHEAD
Future of Video Data Stories - The Smartest Way to Stay Updated
The Videos are personalized, so no matter your role, you will get the insights that matter most to you
Video Data Stories are quick to watch, tag ,and share with colleagues
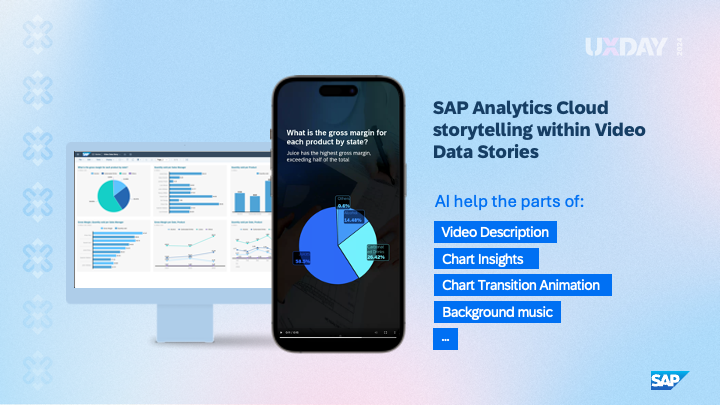
Target AI-related Vision:
In the future scope, we plan to leverage AI to help the parts of:
Video Description
Chart Insights
Complex Chart Transition Animation
Background Music
Much more…
REFLECTIONS & KEY LEARNING
Cross-Department Collaboration:
Value of Diverse Perspectives: Collaboration in Lines of Business enriched the design process. Each team brought unique insights that helped us understand user needs from multiple angles and ensured the design aligns with business objectives.
Regular Touchpoints: Scheduled collaboration sessions fostered a shared understanding of goals and challenges, resulting in a more cohesive approach to the design. Incorporating feedback early from various stakeholders helped refine concepts and accelerated the decision-making process.
Early Risk Identification and Resolution:
Proactive Risk Management: Identifying potential risks related to technical feasibility, user acceptance, and timeline constraints upfront allowed us to devise mitigation strategies early in the project, helping to avoid costly delays.
Stakeholder Review Sessions: Implementing regular review sessions with stakeholders was crucial. These check-ins allowed for real-time feedback and adjustments, ensuring alignment with stakeholder expectations and quickly addressing areas of concern before they escalated.
Adaptability and Resilience:
Responding to Change: Embracing flexibility in our approach allowed the team to adapt to unexpected challenges and evolving project requirements, ultimately enhancing the final outcome.
Home/ VIDEO DATA STORIES / DATA INSIGHTS ENABLER / USABILITY TESTING / LINKED ANALYSIS ASSISTANT / YIRENTAL / SKILL PAL / ORGANICOO / FOBO / SEEK / PLAY / ME