
Model Repointing:
Replace a Model in the Optimized (Unified) Story Experience
“ It would be great if we could change the data model and keep the design of the chart/table by selecting how the new data model maps to the existing data model. Essentially "Link and then Switch" between data models."
Background
There are times where customers are in the course of building a dashboard that goes through multiple life cycles. As a result, they end up consuming data that is from a development datasource and want to transition to production data.
Based on the current capabilities within SAP Analytics Cloud it means that the customer has to recreate the entire story to consume another data source. Hence, there is a desire from customers to support model repointing where they can change the entire data source that is available within a story.
My Role
Product Scoping, Prototyping, Product design, Interaction design, UX quality review
Team
One Product Expert, One Architect, Two Developers, Two Designers (for design crits)
Duration
Apr 2023-Jan 2024
PAIN POINTS & OPPORTUNITIES


For the design process to be successful, we have already simplified the process for users by giving them a platform to design and enhance dashboards with scripting, custom widgets, and other developer capabilities.
However, there is a downside to this flexibility and vast feature set. It makes it difficult for customers when transitioning from the prototyping to build and validation stage. For most customers, it means having to rebuild the dashboard widget by widget.
With this pain point in mind, the initial release of model replacement within the Optimized (Unified) Experience will be possible for our customers. It will be limited to a per model basis and the replacement model must be of the same data source type and structure.
UNDERSTANDING
Business Use Case
Currently when we change a data model in a Story, we lose all Dimensions, Measures, etc. Essentially it clears everything. It would be great if we could change the data model and keep the design of the chart/table by selecting how the new data model maps to the existing data model. Essentially "Link and then Switch" between data models.
Opportunity/Problem will Address
This will address the problem of recreating charts/tables/custom measures from scratch when switching data models. Example, we have two Data Models, both share a number of dimensions, and practically all dimensions measures that is currently used in the story are the same. Yet, there is a requirement to change the underlying source, and it is a pain to having to recreate everything for the new model.
Expected Benefit
A lot of time savings and effort on such scenario's where changing a data model is required.
DESIGN LOGIC
Research
Replacement within Stories is done on a per model basis. The workflow is accessible via the Story Toolbar - Tools Section - Add New Data dropdown, where each model in the story which supports replacement will have a new menu option called "Replace…”.
⚠️ NOTE - the option Replace… will be disabled for models that are not supported with the initial release of model replacement.
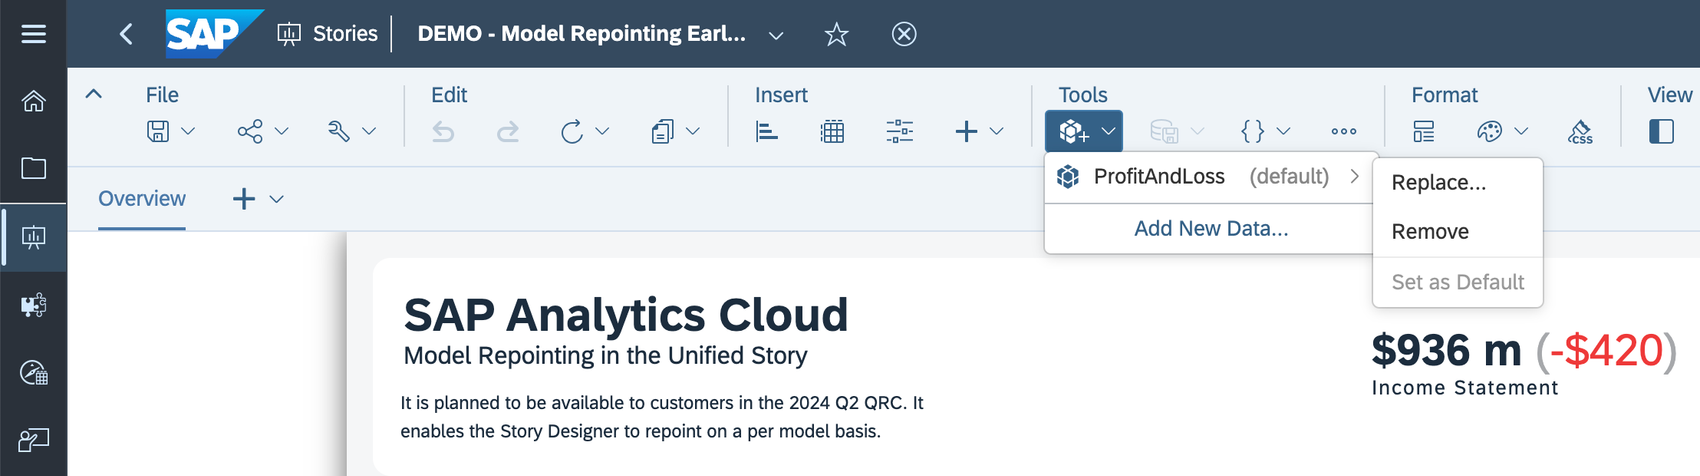
Access Entrance for Replacing Model
Upon the selection of Replace..., the user is guided via the same workflow as changing the data source on a widget. You can either replace the model with one that is already used in the story or select a new one.
⚠️ NOTE - for models that are used within the story, we automatically will hide models that are not compatible with the original model (Enhanced predictability).
Upon selection of the replacement model, a warning is displayed to inform the user about the risks of model replacement. It is a dismissible warning that is remembered for the same edit session. It means that refreshing the browser or navigating to another story will cause the warning to reappear.
Design Logic
Considering the user experience of the business intelligence analysis platform is characterized by "a large amount of data and multiple dimensions", "a certain threshold of business logic understanding" and "diverse user types/perspectives". Based on this, we optimized the ease-of-use design from the following three aspects:
Easy operation: enhanced predictability, efficient operation - key information front-loading
Clarity: Information hierarchy, light and efficient
Easy to learn and easy to understand: efficient and easy to read, aid in judgment
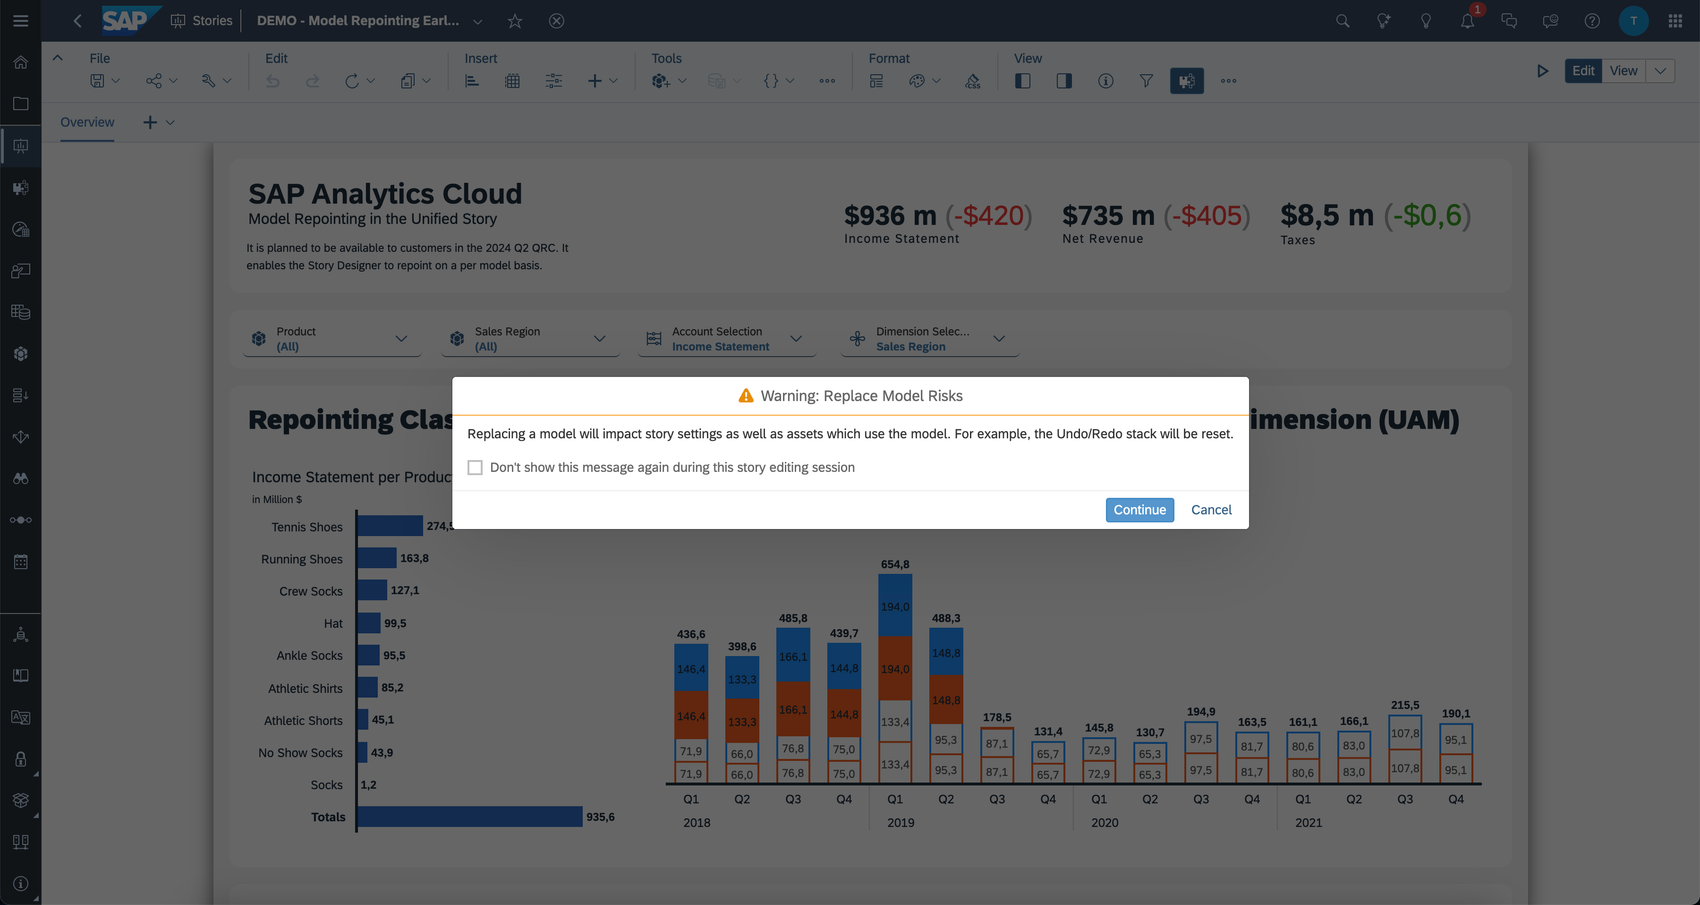
Enhanced Predictability and Warning Indication
As the next step, we will add the data model assuming it is not already used within the story and will analyze all the objects that are used by the original model. You are then in the Model Replacement experience which consists of two sections: Mapping and Summary.
FUNCTION DESIGN
Mapping
Within Mapping there are a few sections that we recommend Story/Dashboard Designers to familiarize themselves with. These include:
Replace Model Header and Global Settings
Replacement Objects
Mapped Objects and Original Objects in Use
Footer & Warnings
Replace Model Dialog by sections
Let’s dive deeper into each section of the dialog.
1. Replace Model Header and Global Settings
These are settings that will impact all objects within the Mapping Dialog. For example, it includes Reset All Mapping, Display Options (ID, Description, or ID & Description), Filter Objects (All, Mapped, Unmapped), and Sort.
2. Replacement Objects
It includes all objects from the Replacement Model. For example, in the screenshot we have selected the New Model Type with an Account Dimension as the Replacement Model. It means that there are three sections available: Accounts, Measures, and Dimensions. Within each header, we show the total number of objects that exist (includes Properties). We do not show hierarchies as these will be available within the Mapped Objects and Original Objects in Use section once a dimension is bound.
⚠️ NOTE - these sections will be different depending on the structure of the replacement model that is selected. For example, for an SAP Business Warehouse Model with 1-Structure would have two sections: Measures and Dimensions (Clarity of info hierarchy).
There are a few objects that will appear in a disabled state. It is because these objects are either mapped or are unavailable until the grouping (parent) object has been mapped. For example, Location is an unmapped object that has several properties such as Area Code, Latitude, Long, and so on. These properties will remain in a disabled state until Location is mapped.
Disabled Entities under Location object
For the various grouping dimensions, we also have icons to represent the dimension type as well as the types of enrichment and properties which are associated with the dimension. For example, the icons on the left side indicate the dimension type (e.g. general, version, time) and the icons on the right side indicate the enrichment and type of properties (e.g the presence of hierarchies, geo properties, image properties, and so on).
3. Mapped Objects and Original Objects in Use
It includes the original models objects that are bound to at least one data related object (i.e. Chart, Table, Geographical Visualization, Calculation, Threshold, and so on). We do not show unused objects from the original model as there is no added value to the user as mapping them would have no impact (Reduce information redundancy).
You will also see the objects that have been auto-mapped either because it is a mandatory object or was because of our auto-mapping detection logic. Our auto-mapping detection logic makes it easier for users who are trying to replace a model with one that closely matches the original model - at least when it comes to the objects in use. In these cases, there would be little to no work required by the user as all objects would be automatically mapped (Easy and efficient operation). Some auto-mapped selections cannot be overridden (e.g. the version dimension) because they are mandatory, but others are a best effort to match objects with the same type and ID or description and could be updated as part of the mapping process.
For unmapped objects, there are two methods to map an object: Drag & Drop or Selection on Empty Unmapped Object.
Drag and Drop
With drag and drop, we will limit the user to mapping objects of the same object type. For example, a user cannot map a measure to account, a hierarchal dimension to non-hierarchical, and so on.
Drag and Drop for Different Object Type
For objects of the same type, we will do validation as soon as the drag object is mapped (Prompt user feedback). It is because there are some objects that while they might appear the same, the semantic type is different (i.e. Parent Child Hierarchy versus Level Based Hierarchy).
Drag and Drop Validation
Selection on the Empty Unmapped Object
With the selection on the empty unmapped object, users are provided a filtered dropdown list. It is limited to objects of the same type. We separate the list by supported vs unsupported objects depending on the semantic type. It provides customers a quick way to map the unmapped objects.

Within this section there is additional system feedback that is available for mapped objects. Users are provided information, warnings, and errors depending on the mapped object.
Information: is low impact context that is available to the user around differences in the formatting of the object. For example, number of decimal places, scale, account type, and so on.
Warning: is an indication that while the objects and semantic type match, there is a difference that is detected that could result in no data shown (i.e. difference in number of hierarchy levels defined)
Error: is an indication that the semantic type of the object is different (i.e. Parent Child Hierarchy vs Level Based Hierarchy, Coordinate vs Area Enriched Geographical Dimension, and so on).
4. Footer & Warnings
Within the footer, we will show the consolidated list of all information, warnings, and errors that were displayed on each object token.
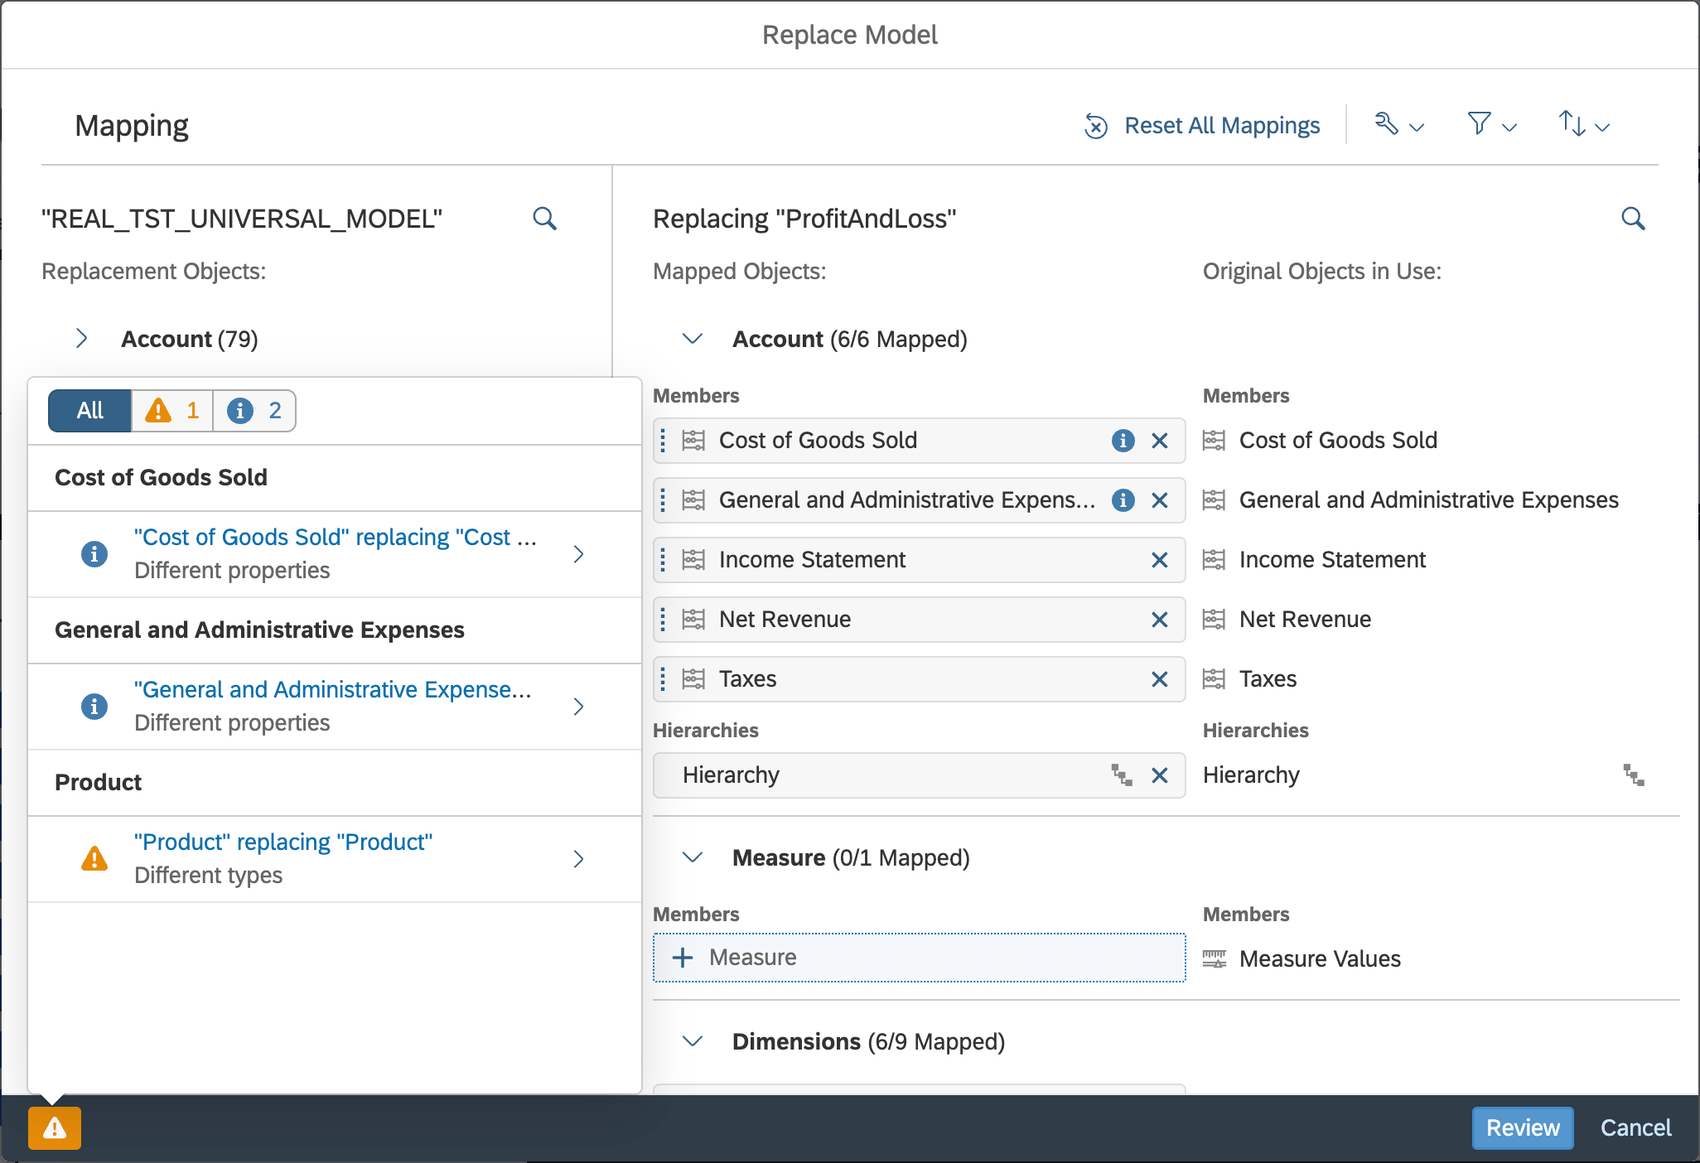
Info & Warnings in Footer Popover
There is also a review and cancel button. We will also allow you to enter the summary page as long as there isn’t an error which represents an invalid mapping. We will allow you to enter the summary page even though all objects have not been mapped.
Summary
Within Summary there are a few sections that we recommend a Story/Dashboard Designer to familiarize themselves with. These include:
Summary Header
Mapping Issues
Story Asset Issues
Additional Impacts
Footer
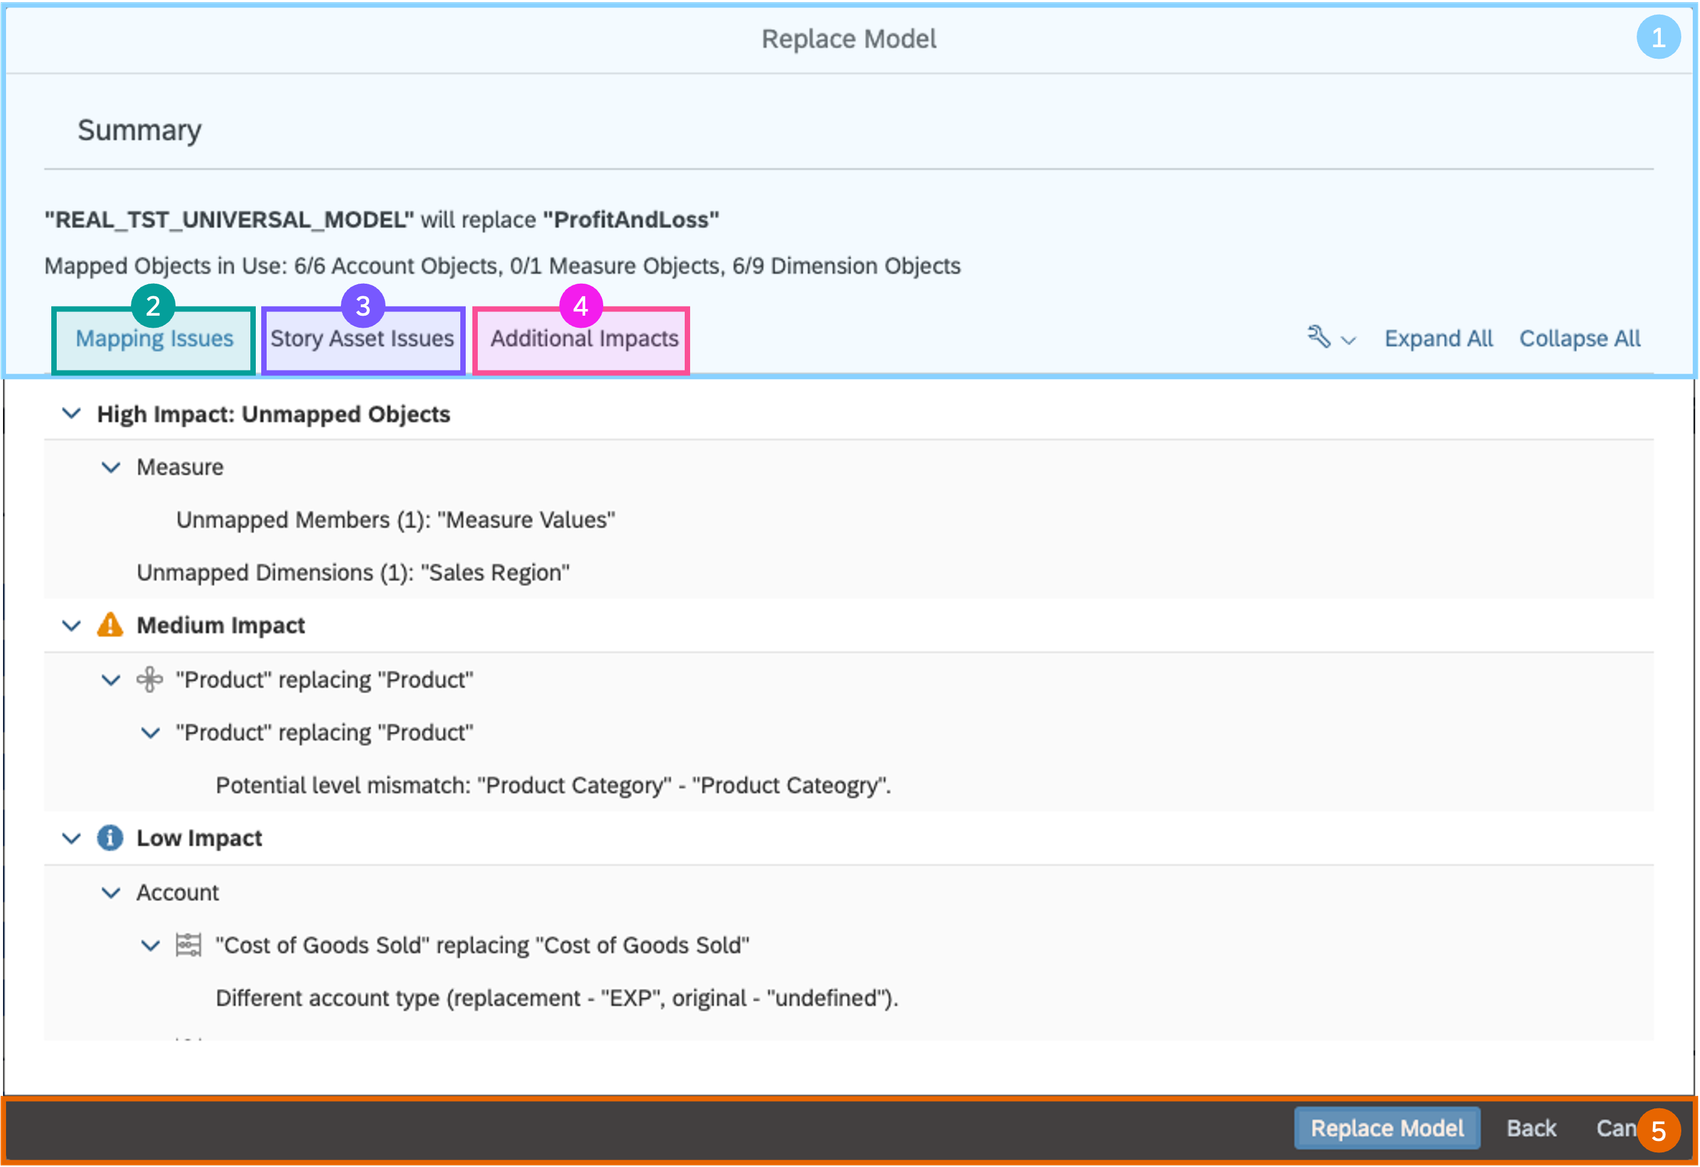
Summary Page including Mapping Issues, Asset Issues and Impacts
Let’s dive deeper into each section of the dialog to familiarize ourselves with the Summary Dialog.
1. Summary Header
It provides an overview of the previous page by informing the Story Designer on which model is being replaced. It also includes a count of mapped objects.
There are additional settings that will apply to all sections such as Display Options (ID, Description, and ID & Description), Expand All, and Collapse All.
2. Mapping Issues
It will provide a summary of the unmapped objects from the previous page as well as any warnings or info tips that may have been missed. You will not see any of the errors from the previous page as we prevent you from entering this dialog when there is the detection of at least one error caused by invalid mapping (Anticipatory design in advance to simplify user decisions).
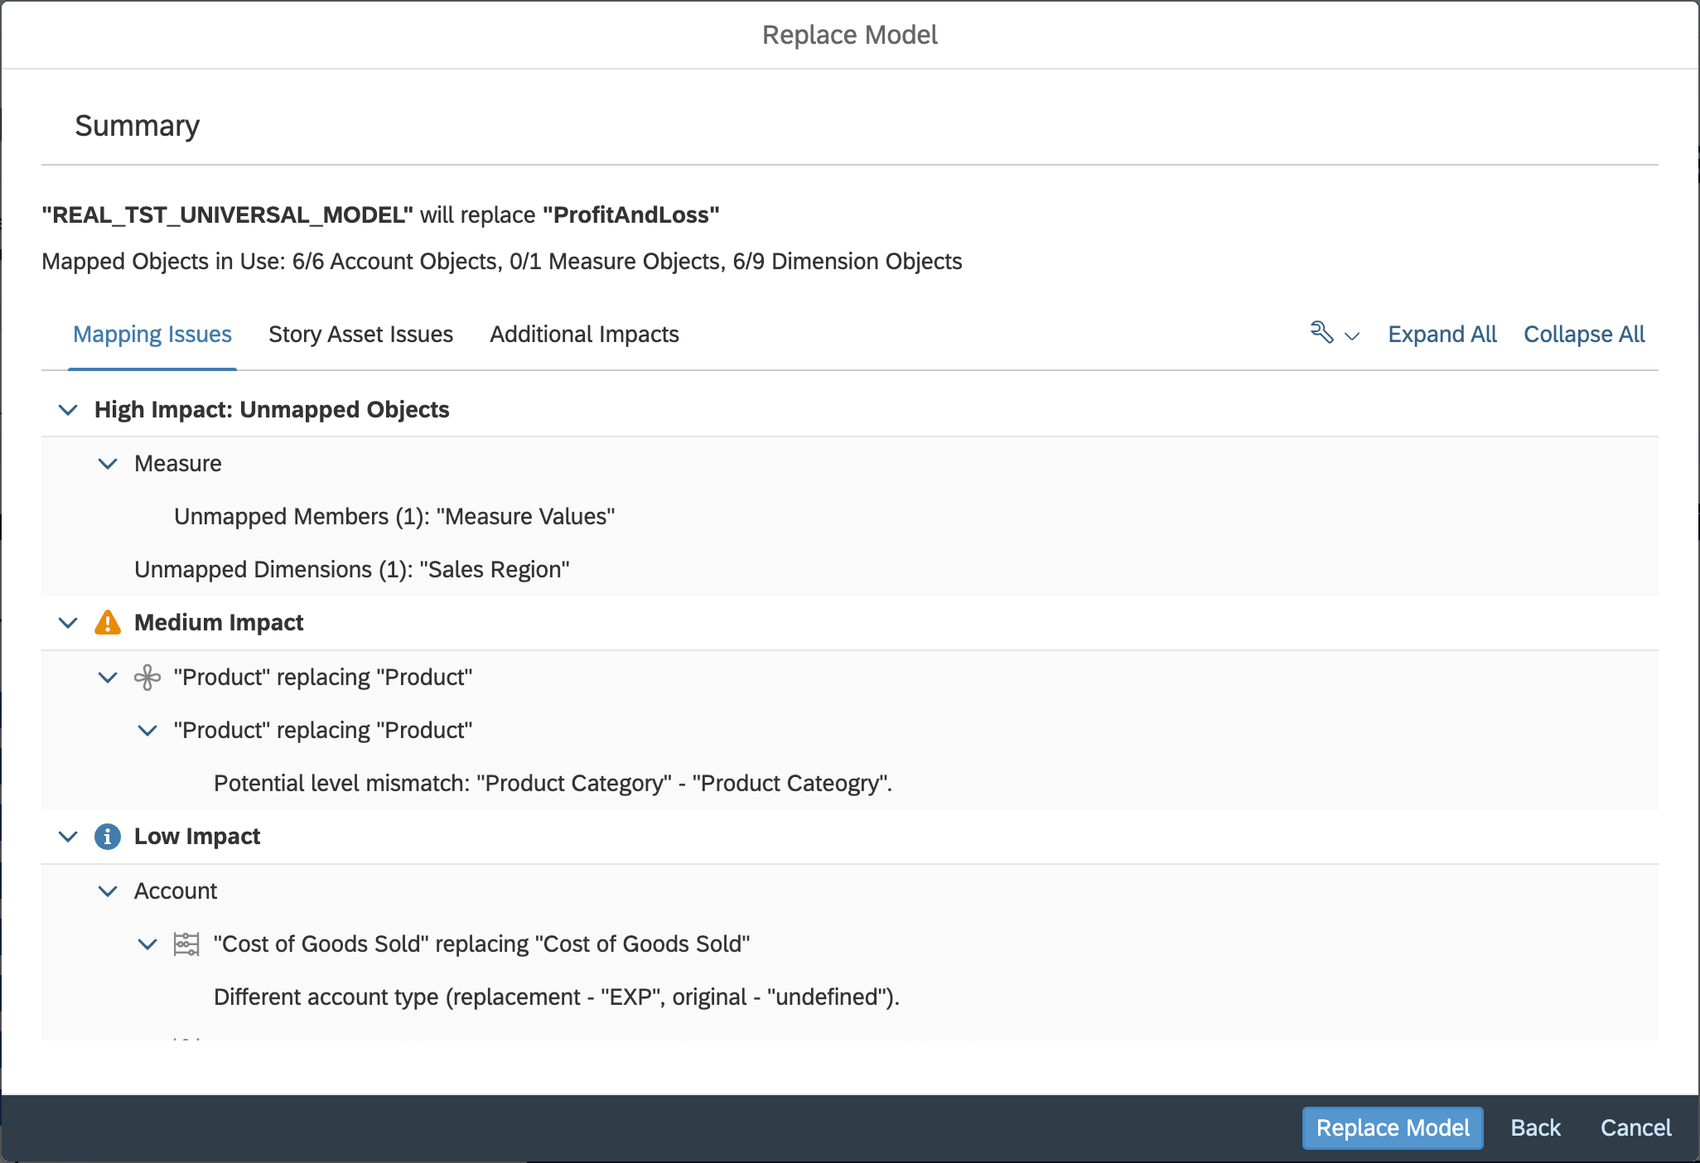
Mapping Issues in Summary
This is a UX technique of simplifying processes and responding to user needs one step before they actually express those needs
3. Story Asset Issues
It provides a summary of the impacted assets and controls as a result of the mapping issues. We break it down into Story Assets such as Linked Dimension, Account Input Control, Color Sync, Thresholds, and so on.
We also then provide a detailed overview per page as well as each story component per page. While there might be some duplicate information, we wanted the Story Designer to understand the impact per story component.
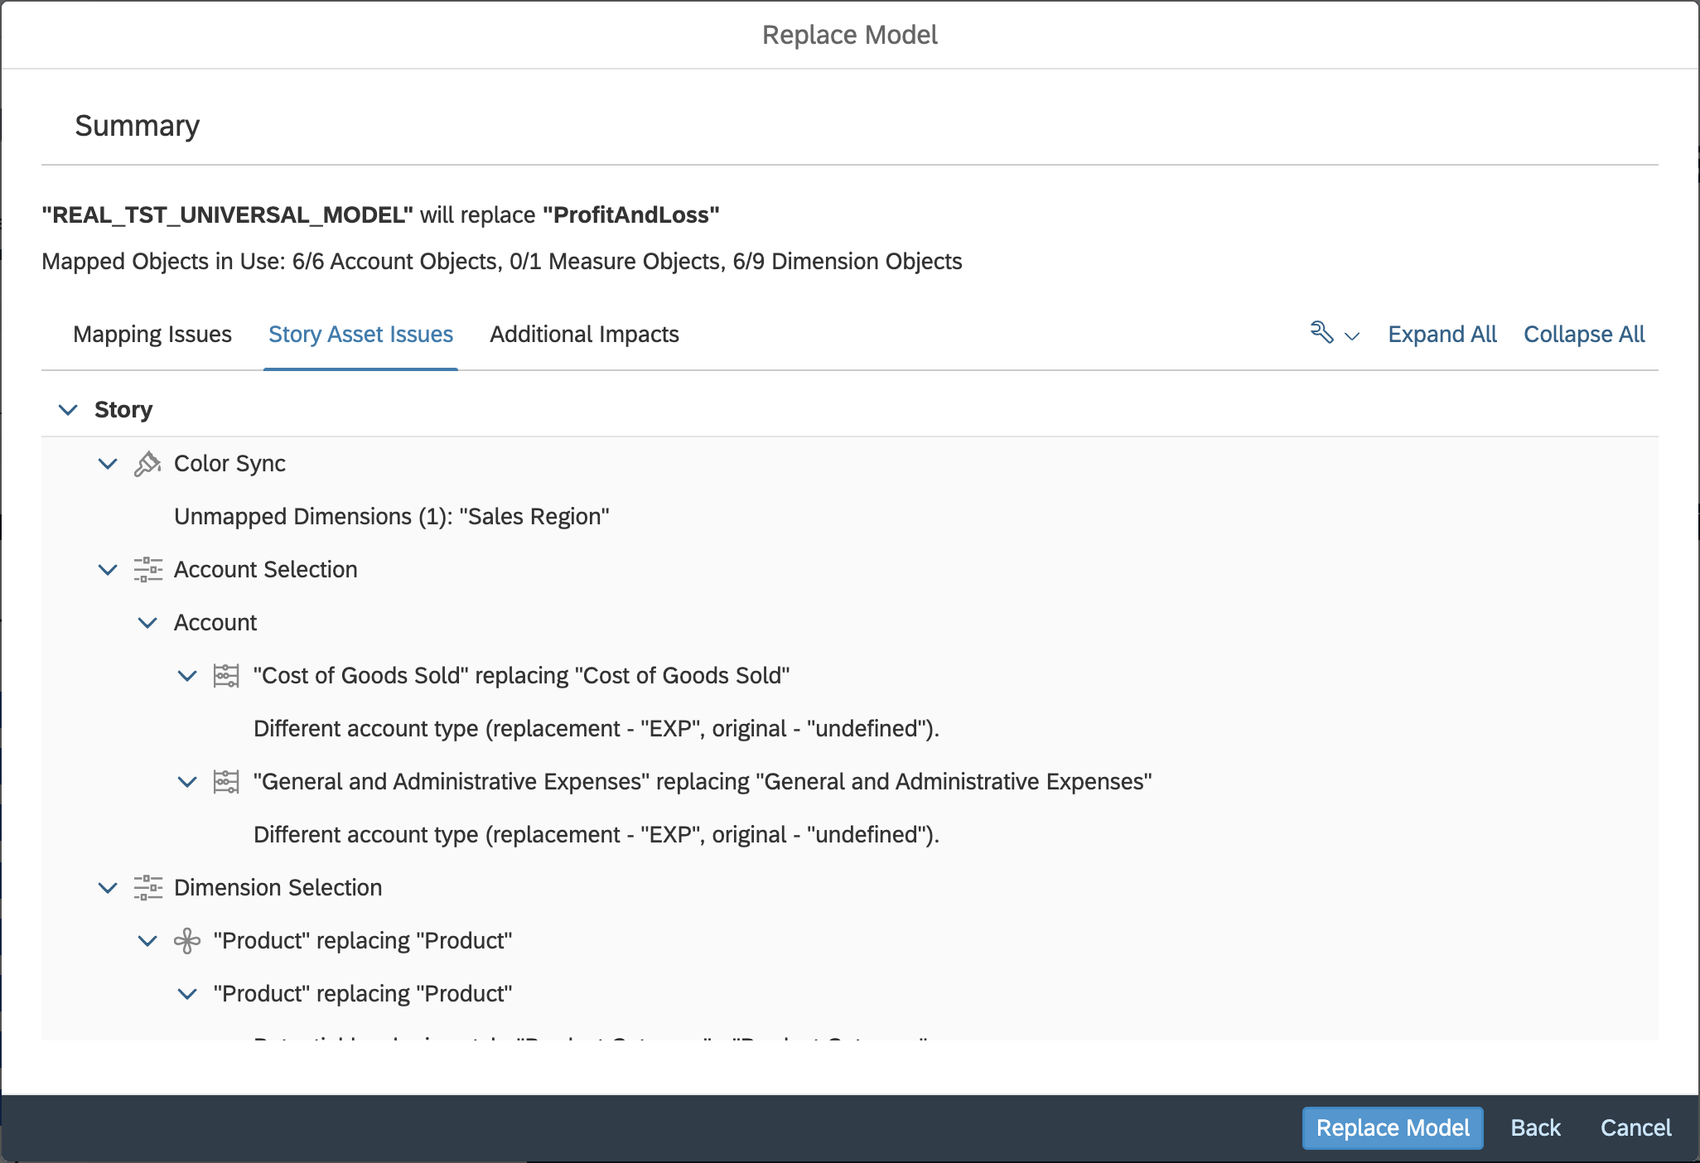
Story Asset Issues in Summary
4. Additional Impacts
These are a summary of controls that will not be remapped as these are existing limitations with Model Replacement. The list of items will dynamically update based on what is used within the Stories.
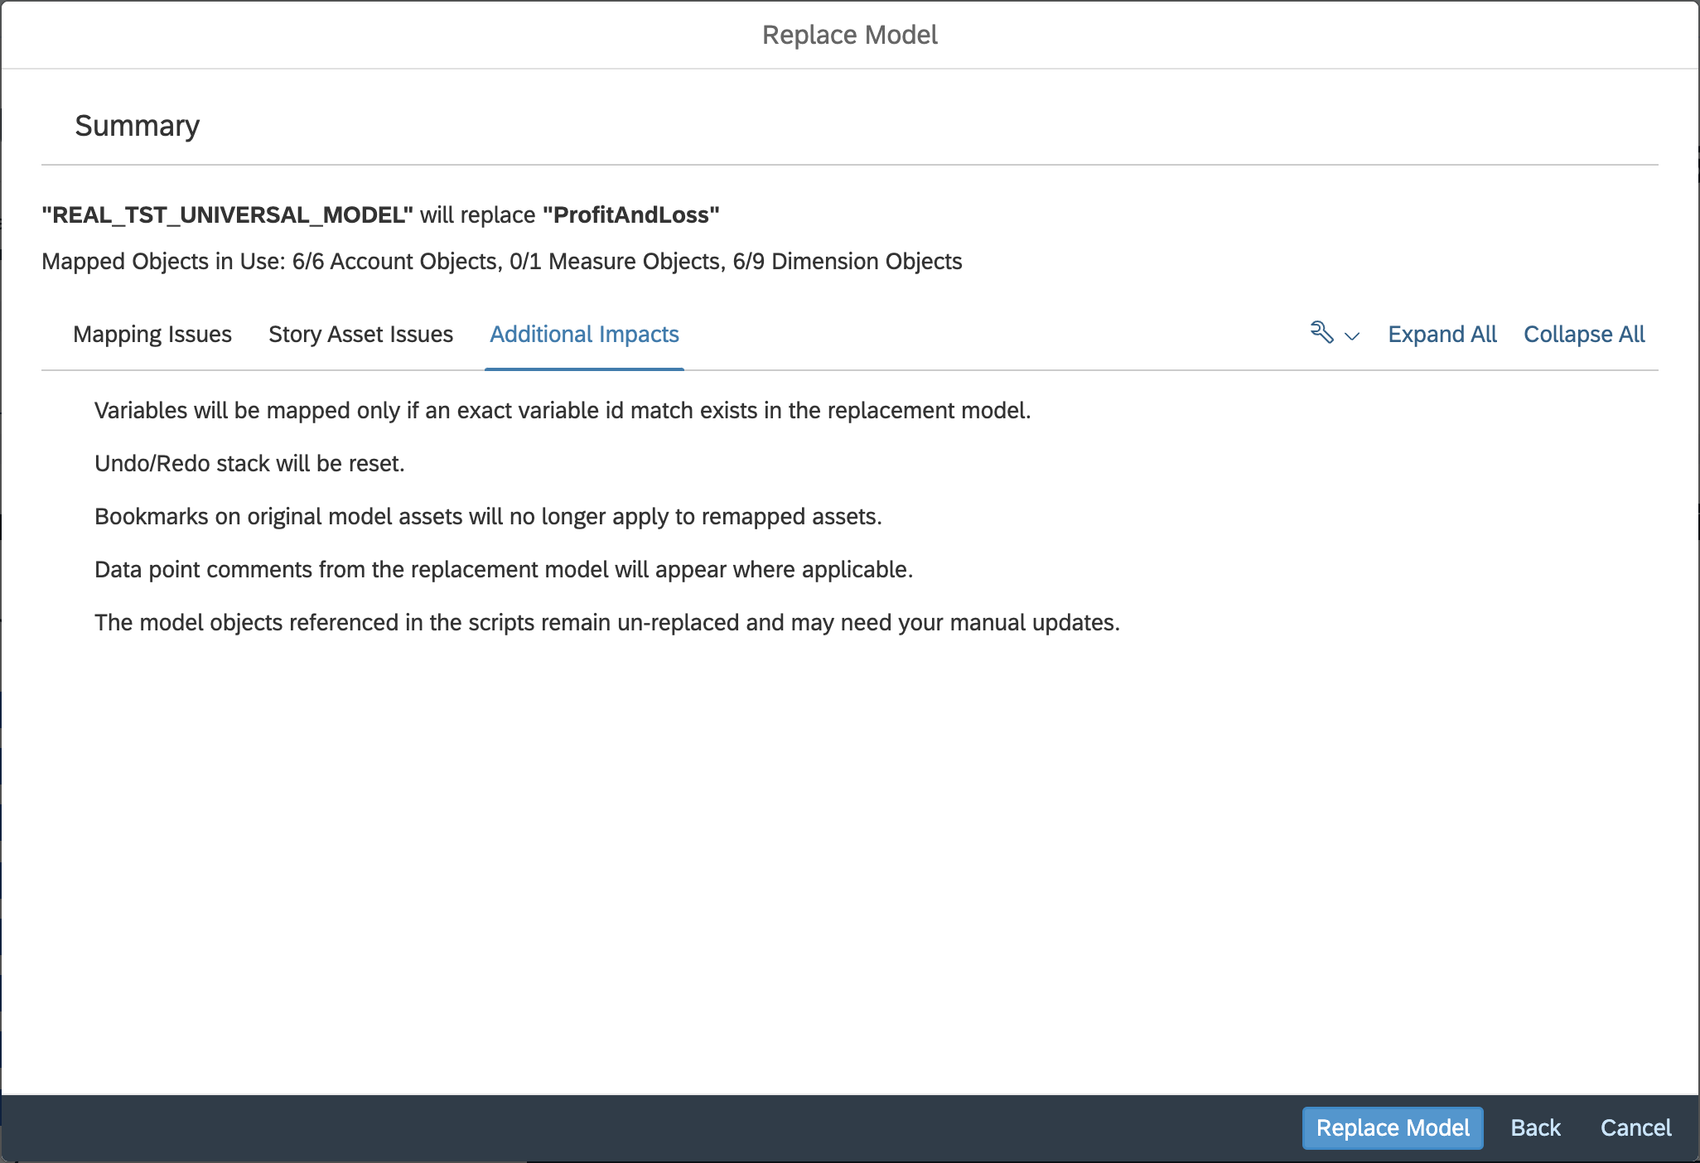
Additional Impacts in Summary
5. Footer
Within the footer, you will have the option to complete the model replacement, go back to edit any of the mapped objects or cancel the entire replacement.
Completing the Replacement
Once the Story Designer clicks on Replace Model we will reload the active page and replace the objects. It is not an undoable action and we leave the story as marked as dirty in case you want to discard the changes from the replacement.
For objects that were left unmapped, the individual story components that are impacted will remain in a broken state. There binding will remain and it would be up to the Designer to remove the broken object from the story component. For example, in the screenshot below, the location dimension was not bound at the time of the model replacement and remains in a broken state.
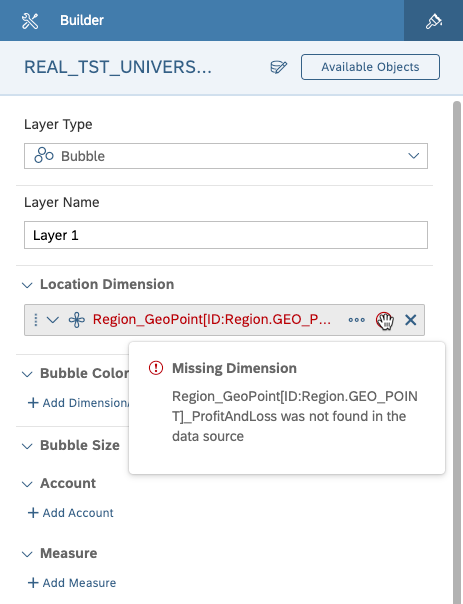
Broken State - The location dimension was not bound
It is through this enhancement, we continue to expand the feature set that is available in SAP Analytics Cloud and address a major gap when transitioning from the prototyping to build and validation stage. It makes it easier for Designer to replace an existing model within Stories.
ITERATION IDEATION & DESIGN SPEC GALLERY
Dialog Anatomy - Main Screens
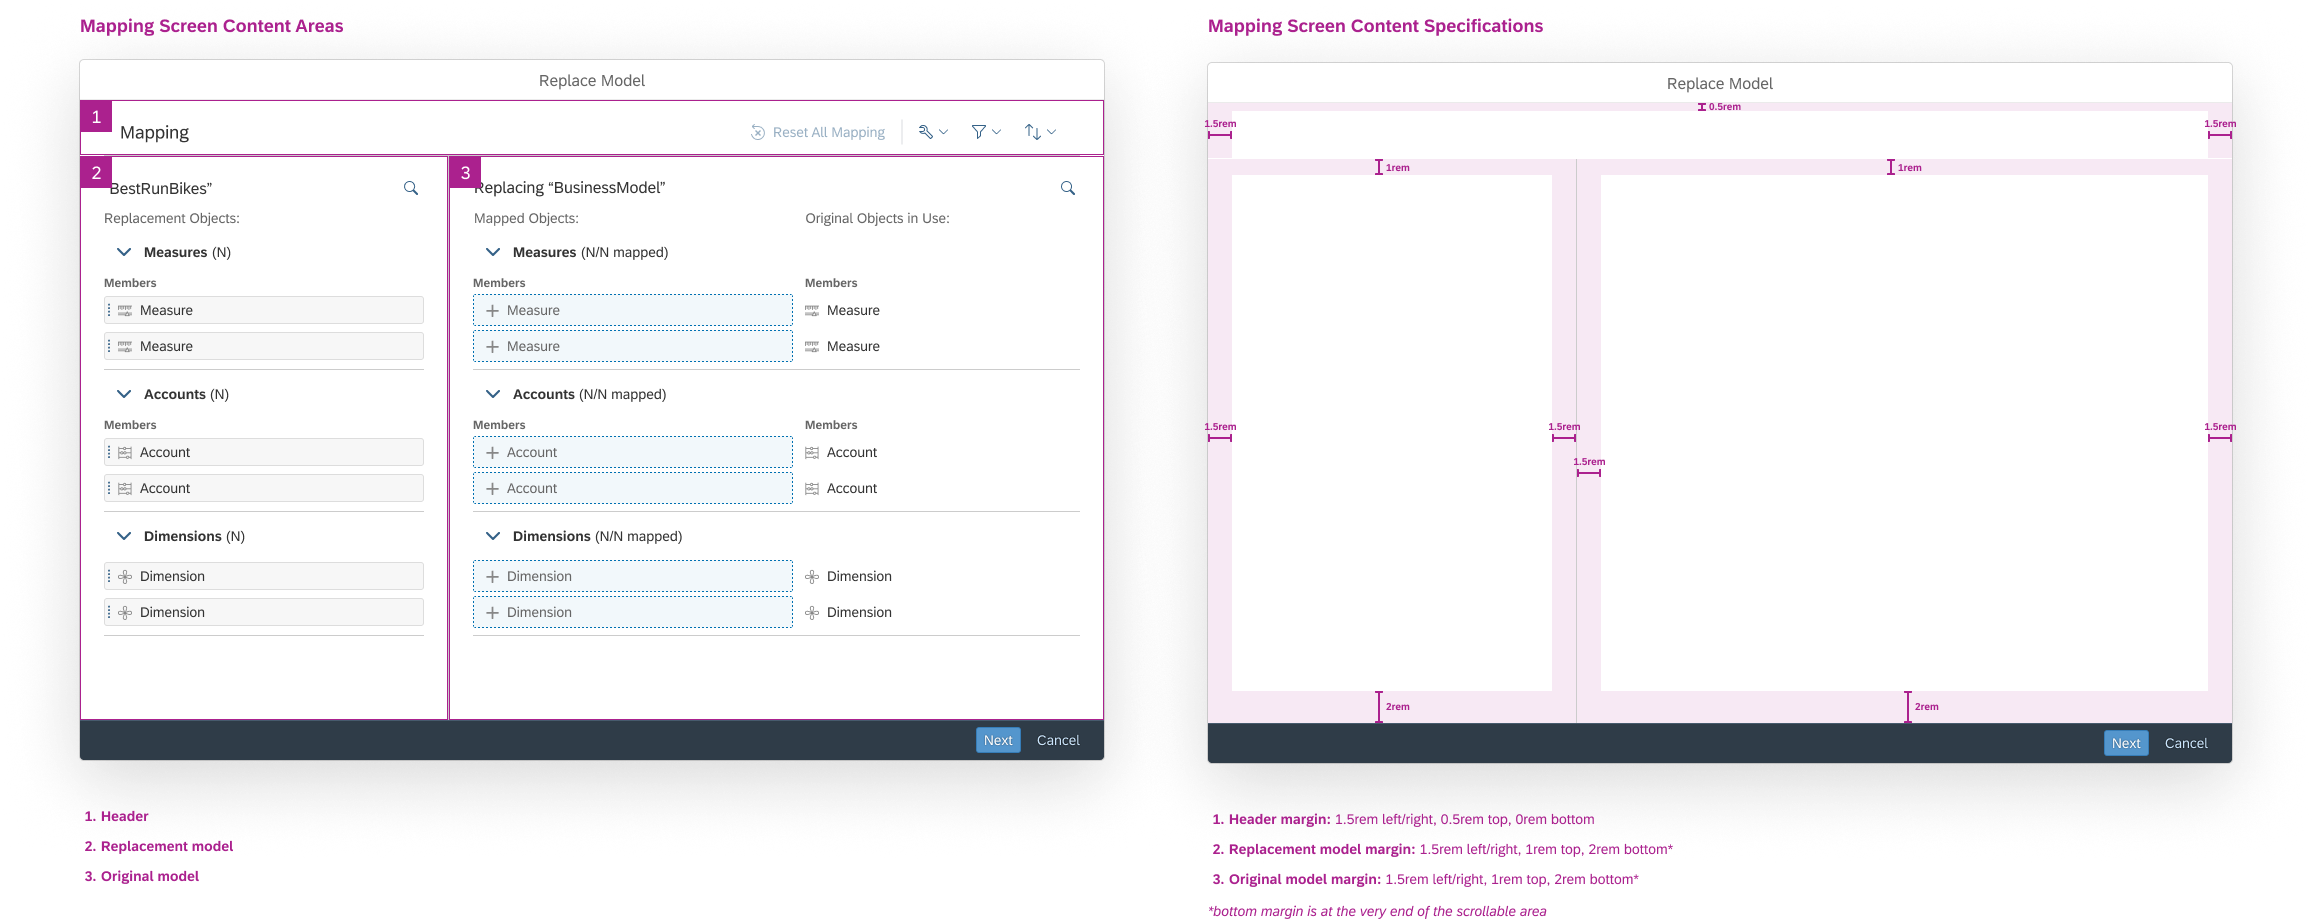
Mapping Screens of Dialog Anatomy
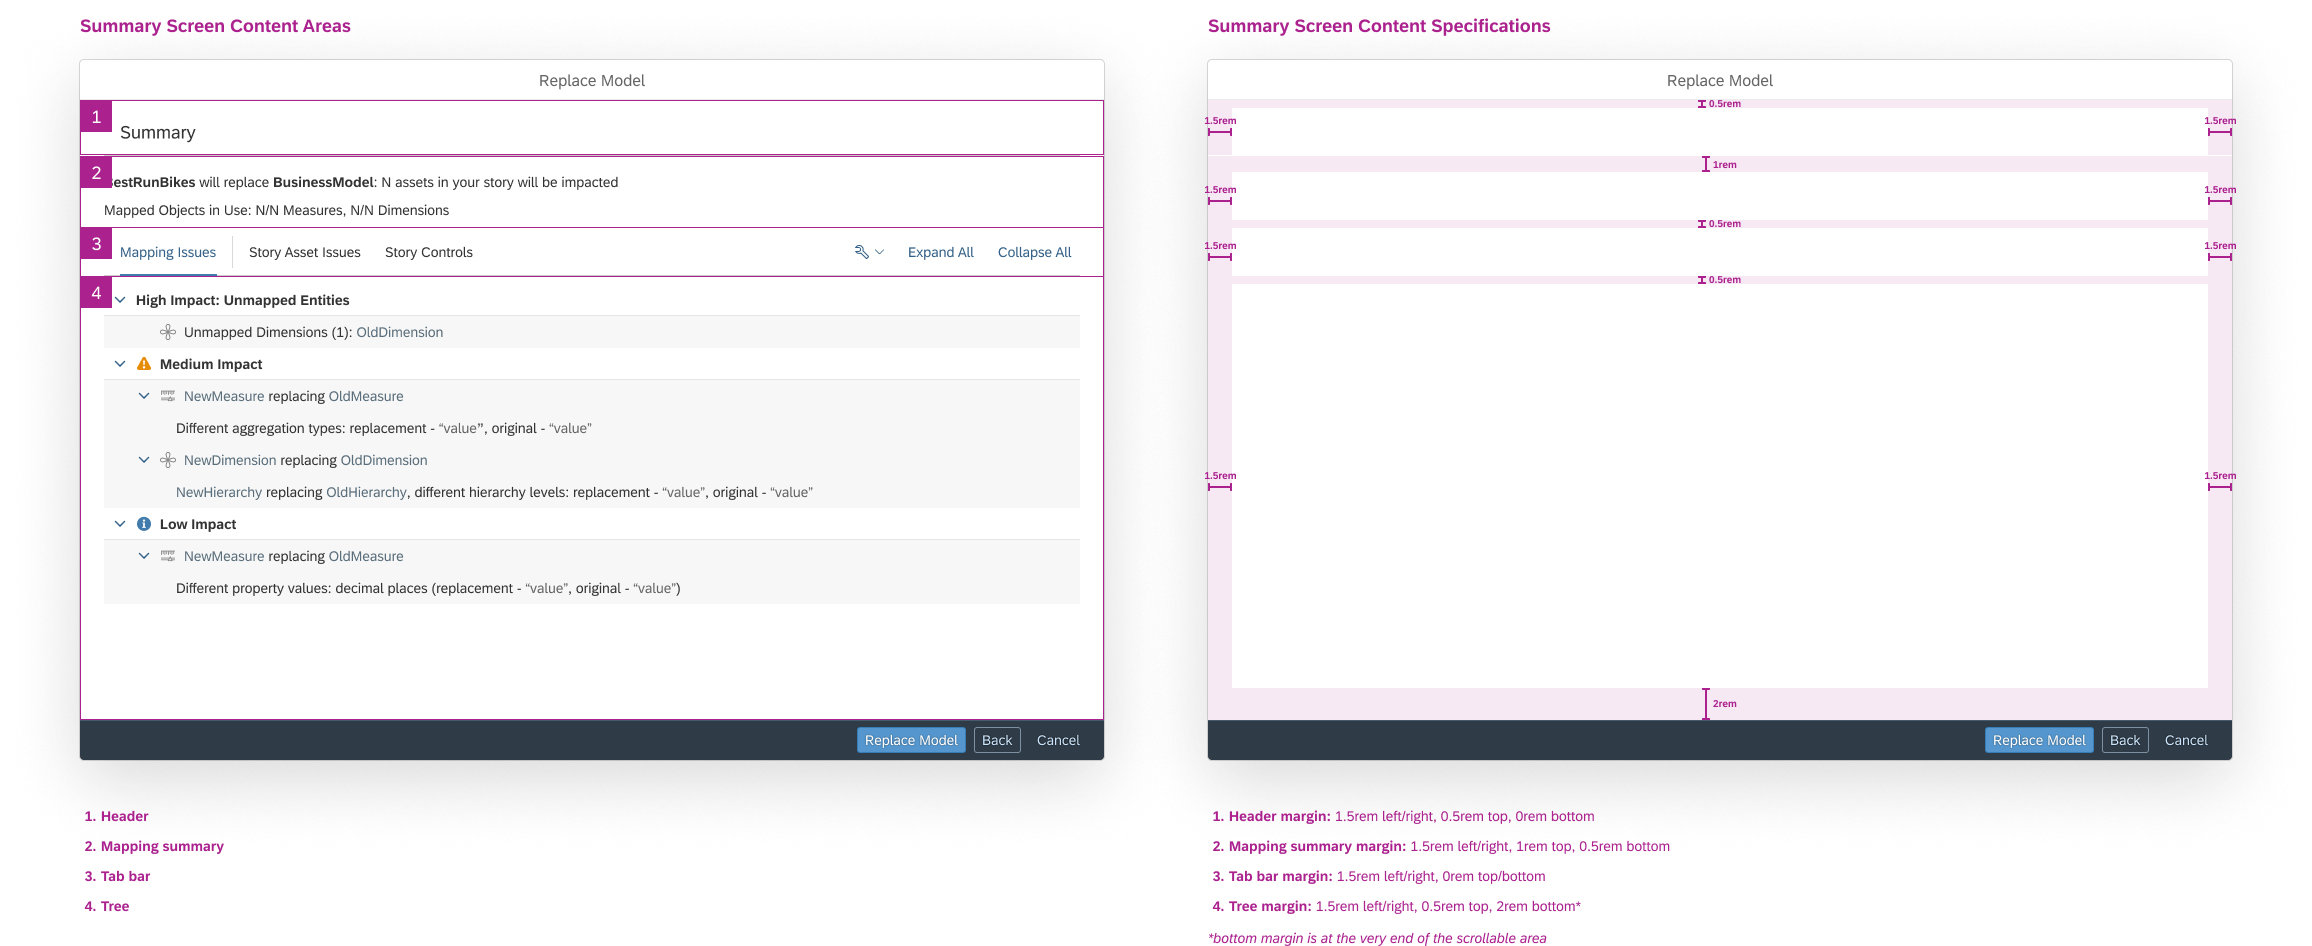
Summary Screens of Dialog Anatomy
Mapping Behaviors
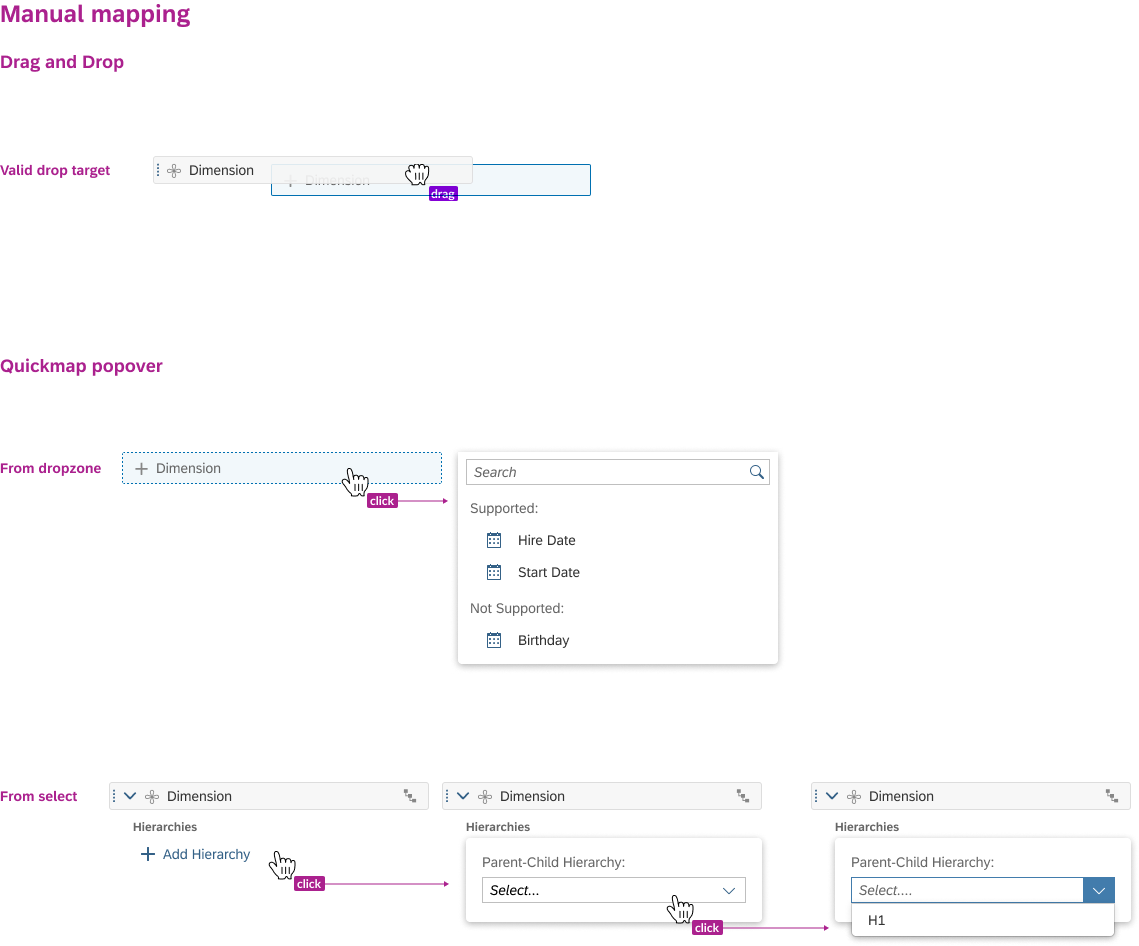
Manual Mapping - Drag and Drop/Quick-map popover
⚠️ NOTE - In both drag and drop and quick-map popover mapping interactions, whenever the user maps a collapsed parent object, we will auto-expand the object to expose the children. As not all dimension properties can be auto-mapped by parent-mapping, we want to improve the visibility of any further work required by the user.
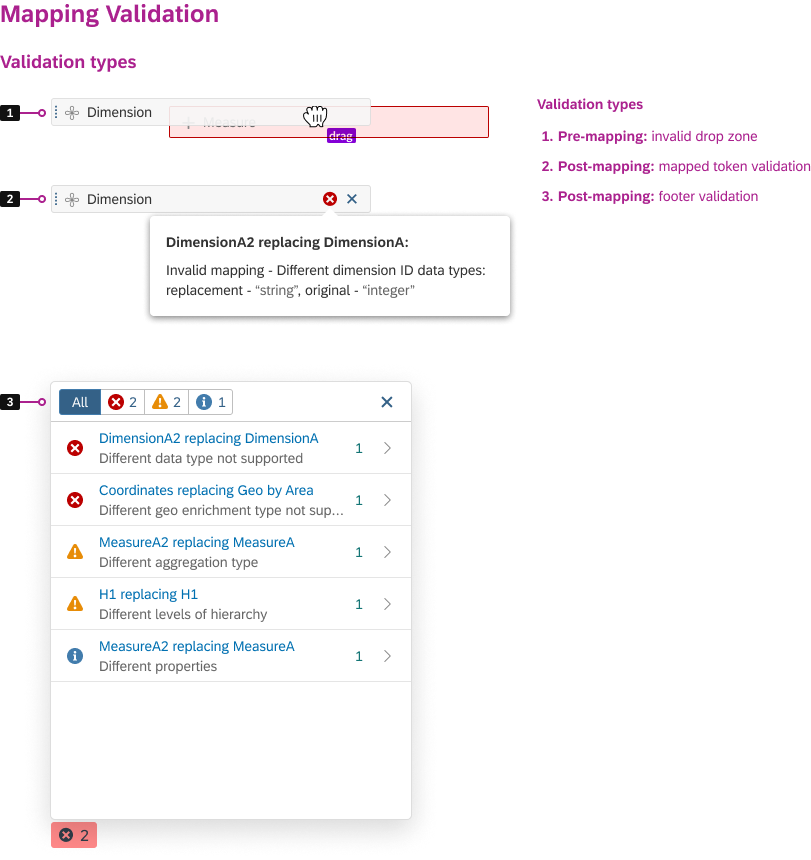
Mapping Validation Types
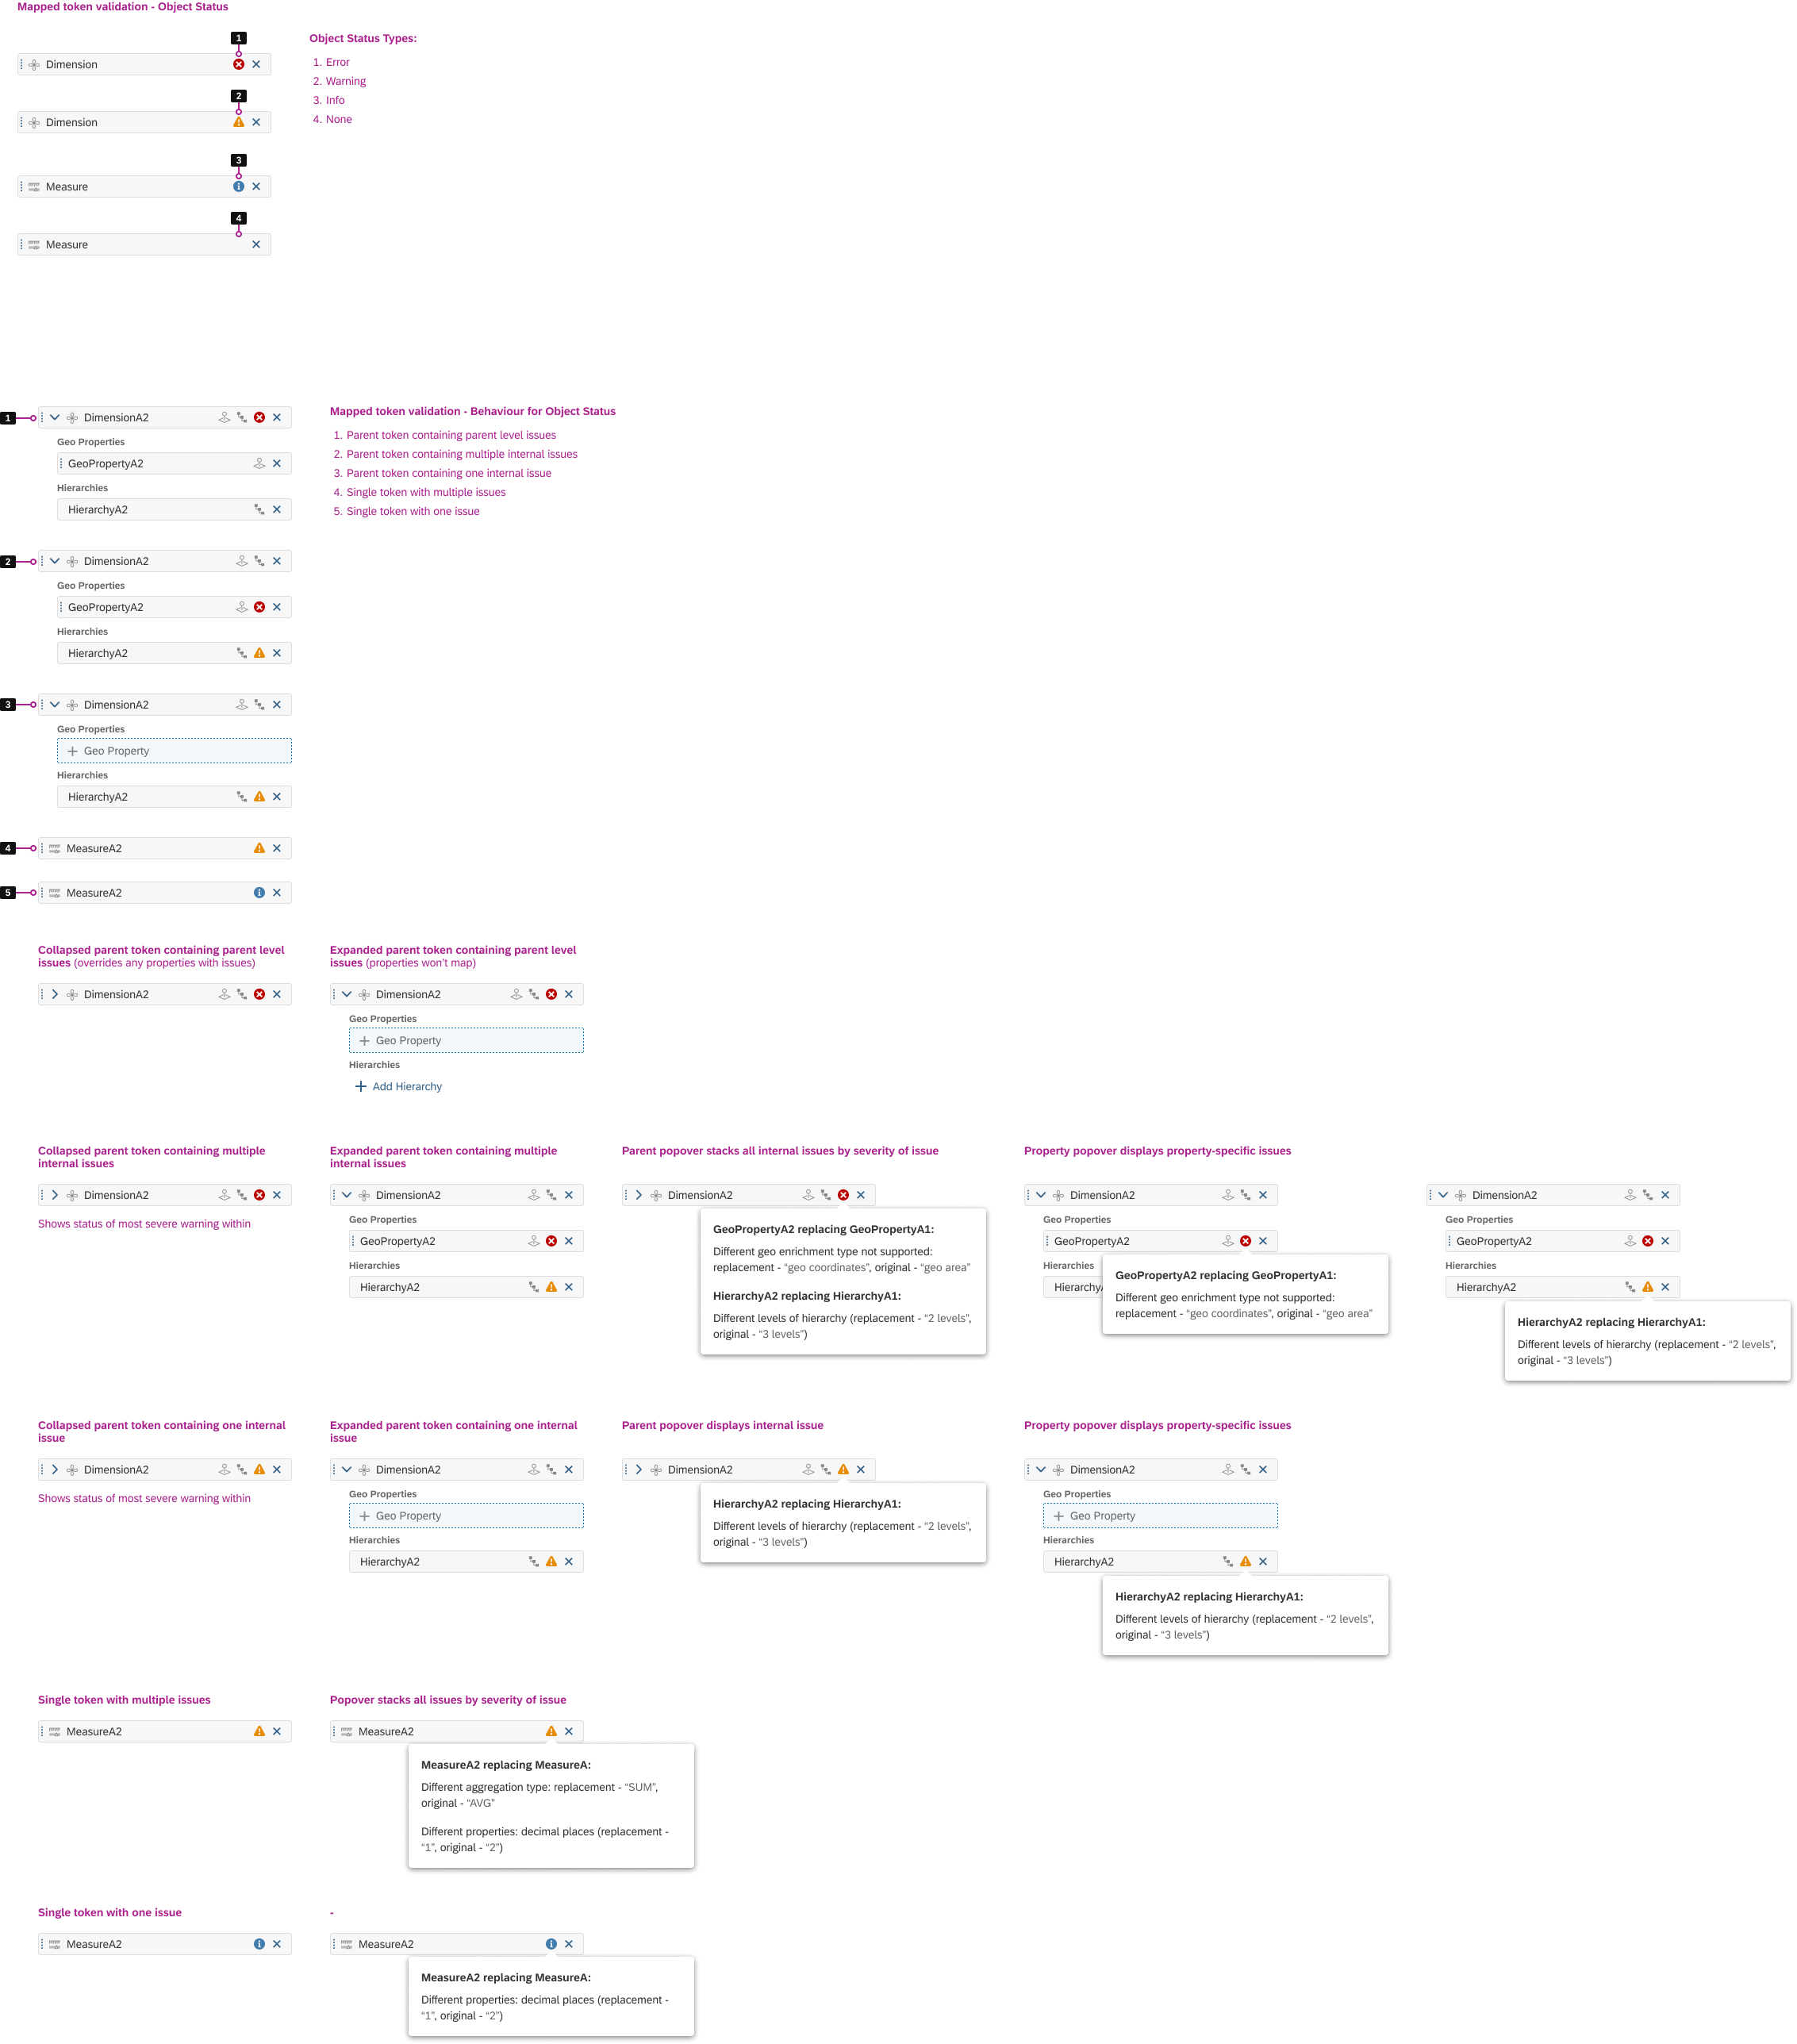
Mapped Token Validation - Object Status
VALUE & INFLUENCE
Dashboards are essential for tracking the performance of an organization as they show the key metrics in one place. It is achieved by following a detailed step-by-step process. For instance, a dashboard lifecycle will have various stages such as planning, requirements gathering, prototyping, build and validation, and then go-live and maintenance.
It is through this enhancement, we continue to expand the feature set that is available in SAP Analytics Cloud and address a major gap when transitioning from the prototyping to build and validation stage. It makes it easier for Story Designer to replace an existing model within Stories.
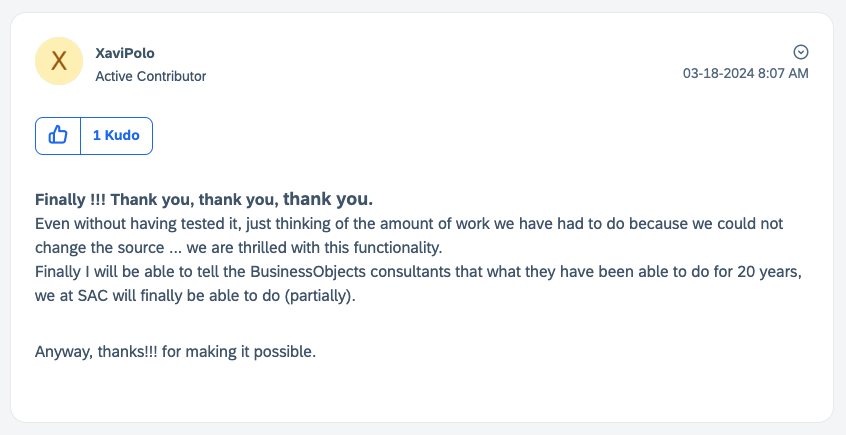
Selected Customer Feedback
TAKEAWAYS & REFLECTION
User-Centered Focus
One of my key takeaways is the importance of maintaining a user-centered approach throughout the design process. Engaging directly with users and stakeholders allows me to identify genuine needs and pain points, resulting in more effective solutions.
Collaboration and Communication
Effective collaboration with cross-functional teams is crucial. I’ve realized that sharing my design rationale and being open to feedback fosters a more collaborative environment, leading to innovative solutions that align with both user needs and business goals.
Embracing Constraints
Whether they are technical, budgetary, or time-related, constraints can often spur creativity. I’ve come to appreciate how working within limits can lead to clever solutions and innovative design, pushing me to think outside the box.
Reflection
My UX design journey for this project has highlighted the value of empathy, collaboration, and iteration. Engaging with users drives my focus on creating meaningful solutions, while I embrace feedback and constraints as opportunities for creativity.
Home / MODEL REPOINTING / DATA INSIGHTS ENABLER / USABILITY TESTING / LINKED ANALYSIS ASSISTANT / YIRENTAL / SKILL PAL / ORGANICOO / FOBO / SEEK / PLAY / ME